バシラスという菌が季節性(夏)に増えるという話を聞いた(Eur J Clin Microbiol Infect Dis. 2014 Aug;33(8):1371-9.)
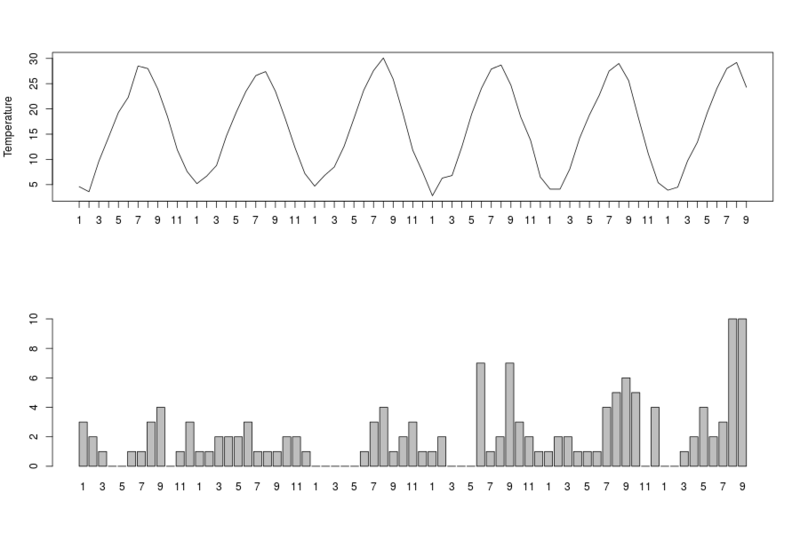
論文の図からデータが取れるので、月別のバシラス発生数をrstanで推定する。
バシラスという菌はグラム陽性の桿菌で、臨床検体である血液培養から検出されたらほぼ確実にカテーテル関連である。
なぜカテーテルから出るかというと、そもそも環境中に存在していて、タオルや衣類、医療関係者の手から移り、カテーテルや血管ルートなどにひっつく。
これが夏になると増える、というのがクエスチョンで、病院のある都市の気温と並べてプロットしてある。論文では真の菌血症とコンタミネーションを区別しているが、今回は血液培養で検出された、として一括して考える。
気温のデータは気象庁からパクれる。

見た感じ、1ヶ月のバシラス検出数はポアソン分布とみなしてよさそう。ポアソン分布のパラメータであるを適当に指数関数からサンプリングして、1ヶ月のバシラス検出がポアソン分布からサンプリングされる、みたいな感じでstanに投げる。
月の平均気温のパラメータ, 月ごとの
に対するパラメータ
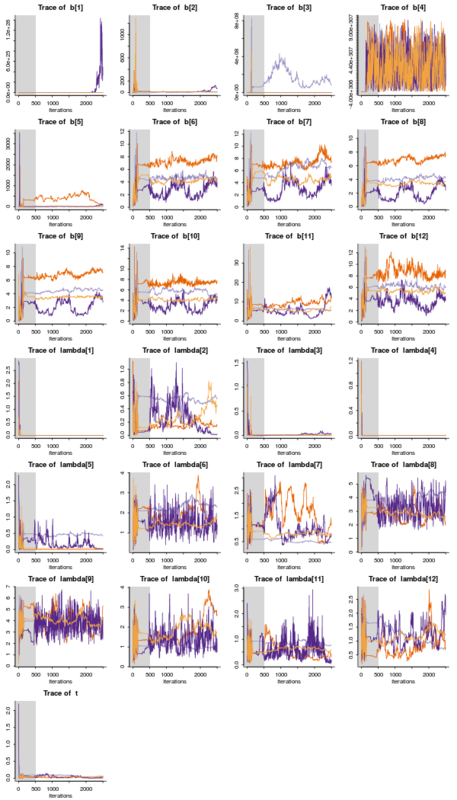
がものすごい荒ぶって収束してないけど無視。

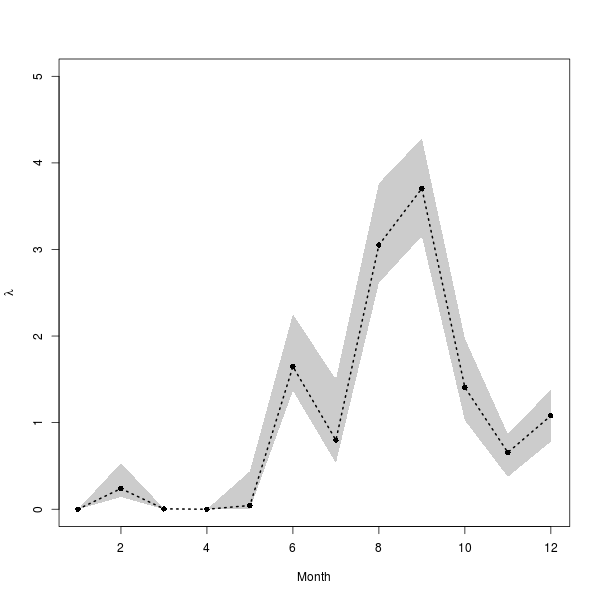
月ごとのはそれなりにうまくいったようで、6月から9月にかけてバシラス検出数がかなり増えている感じになった。

# bacillus.stan
data {
	int N;
	int<lower=0> bacillus[N];
	real<lower=0> temp[N];
	int<lower=0> month[N];
}
parameters {
	real beta;
	real<lower=0> t;
	real<lower=0> b[12];
	real<lower=0> lambda[12];
}
model {
	for(n in 1:N){
		lambda[month[n]] ~ exponential(beta + t*temp[n] + b[month[n]]);
		bacillus[n] ~ poisson(lambda[month[n]]);
	}
}
dat <- read.delim("下からパクろう", stringsAsFactors=FALSE)

par(mfrow=c(2, 1))
plot(dat$temp, type="l" ,xaxt="n", xlab="", ylab="Temperature")
axis(1, at=seq(dat$month), labels=dat$month)
barplot(dat$Bacillus, names.arg=dat$month)

stanmodel <- stan_model("bacillus.stan")
standata <- list(N=nrow(dat), bacillus=dat$Bacillus, temp=dat$temp, summar=summar, month=dat$month)
fit <- sampling(stanmodel, data=standata, chains=4, warmup=500, iter=2500, seed=1234)

traceplot(fit, pars=c("b", "lambda", "t"), nrow=7, ncol=4)
ex <- extract(fit)

# 80% 信用区間
CI <- apply(ex$lambda, 2, quantile, c(0.2, 0.8))

yl <- c(0, 5)
plot(1:12, ylim=yl, type="n", xlab="Month", ylab=expression(lambda))
polygon(c(1:12,12:1), c(CI[1,],rev(CI[2,])), col=grey(0.8), border=NA)
lines(apply(ex$lambda, 2, median), pch=16, type="o" ,lty=3, lwd=2)
Bacillus	year	temp	month
3	2008	4.6	1
2	2008	3.6	2
1	2008	9.6	3
0	2008	14.4	4
0	2008	19.3	5
1	2008	22.3	6
1	2008	28.5	7
3	2008	28	8
4	2008	24	9
0	2008	18.5	10
1	2008	11.9	11
3	2008	7.6	12
1	2009	5.2	1
1	2009	6.7	2
2	2009	8.8	3
2	2009	14.6	4
2	2009	19.3	5
3	2009	23.5	6
1	2009	26.6	7
1	2009	27.4	8
1	2009	23.5	9
2	2009	18.1	10
2	2009	12.3	11
1	2009	7.2	12
0	2010	4.7	1
0	2010	6.8	2
0	2010	8.5	3
0	2010	12.6	4
0	2010	18.1	5
1	2010	23.7	6
3	2010	27.6	7
4	2010	30.1	8
1	2010	25.9	9
2	2010	19.1	10
3	2010	11.8	11
1	2010	7.5	12
1	2011	2.8	1
2	2011	6.3	2
0	2011	6.8	3
0	2011	12.5	4
0	2011	19	5
7	2011	24.1	6
1	2011	27.9	7
2	2011	28.7	8
7	2011	24.7	9
3	2011	18.4	10
2	2011	13.8	11
1	2011	6.5	12
1	2012	4.1	1
2	2012	4.1	2
2	2012	8.1	3
1	2012	14.2	4
1	2012	18.8	5
1	2012	22.7	6
4	2012	27.5	7
5	2012	29	8
6	2012	25.6	9
5	2012	18.2	10
0	2012	11.1	11
4	2012	5.4	12
0	2013	3.9	1
0	2013	4.5	2
1	2013	9.7	3
2	2013	13.4	4
4	2013	19.2	5
2	2013	24.1	6
3	2013	28	7
10	2013	29.2	8
10	2013	24.3	9