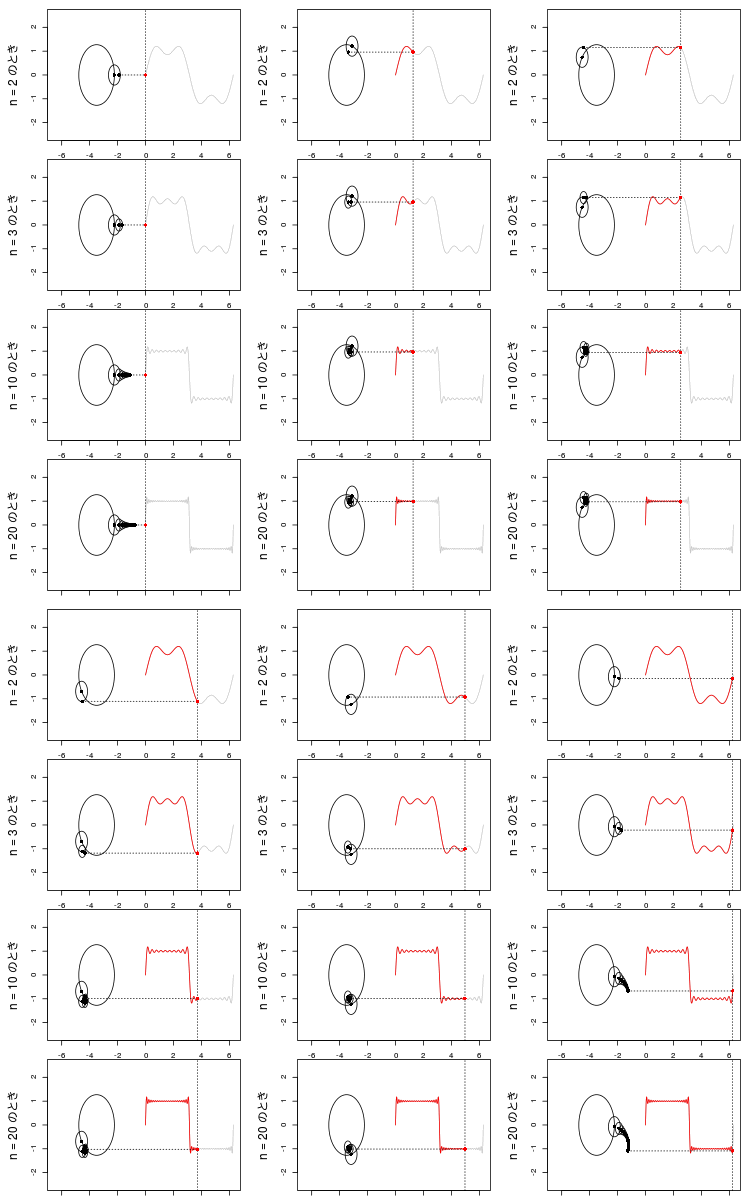
矩形波がフーリエ変換の要素数を増やすとどれくらい近似度があがるかという動画を見かけたのでやってみる。
矩形波は
となる。
が増えると近似度があがり、そのための小さな円が数珠つなぎに増える。
矩形波の平坦な部分はこの数珠がぐるぐる巻にされ、yが入れ替わるところで数珠がダイナミックに伸びるのがわかる。

GIFにするとこんな感じ。

f <- function(n, x) 4/pi*sin((2*n-1)*x) / (2*n-1)
x <- seq(0, 2*pi, length=1000)

p <- 4/pi
y <- f(1, x)
xl <- c(-6.5, 2*pi)
yl <- c(-1, 1)*p*2
xc <- 3.5
Ns <- c(2, 3, 10, 20)
for(i in seq(x)){
  x0 <- x[i]
  png(sprintf("%04d.png", i), 250, 600)
  par(mar=c(1, 5, 1, 1), mfcol=c(length(Ns), 1), cex.lab=1.5)
  for(N in Ns){
    y <- rowSums(mapply(function(z) f(z, x), 1:N))
    plot(x, y, xlim=xl, ylim=yl, type="l", xlab="", ylab=sprintf("n = %d のとき", N), col=gray(0.8))
    lines(x[seq(i)], y[seq(i)], col="red")
    abline(v=x0, lty=3)
    plot.circle(-xc, 0, p)
    x1 <- cos(x0)*p - xc
    y1 <- sin(x0)*p
    points(x1, y1, pch=16)
    for(n in 2:N){
      plot.circle(x1, y1, p/(2*n-1))
      x1 <- x1 + cos((2*n-1)*x0)/(2*n-1)
      y1 <- y1 + f(n, x0)
      points(x1, y1, pch=16)
    }
    segments(x1, y1, x0, lty=3)
    points(x0, y1, pch=16, col="red")
  }
  dev.off()
}


# 実際には lines 関数を呼ぶので,... には lines 関数が許容する引数を書くことができる。
plot.circle <- function(ox, oy, r, start=0, end=360, ...)
{
        plot.ellipse(ox, oy, r, r, 0, start, end, ...)
}

# 中心を (ox, oy) とする,半径 r の円を描き,内部を塗りつぶす。
# 実際には polygon 関数を呼ぶので,... には polygon 関数が許容する引数を書くことができる。
plot.circlef <- function(ox, oy, r, ...)
{
        plot.ellipse(ox, oy, r, r, 0, 0, 360, func=polygon, ...)
}

# 中心を (ox, oy) とする,長径 ra,短径 rb の楕円を描く。
# phi は楕円の傾き(長径が水平線となす角度),start, end には,描き始めと描き終わりの位置を指定できる。
# 長径を基準として,角度(度単位)で指定できる(0, 360 とすると,完全な楕円を描くことになる。
# 90, 270 とすると,左半分の楕円を描くことを指示することになる)。
# 実際には lines 関数を呼ぶので,... には lines 関数が許容する引数を書くことができる。
plot.ellipse <- function(ox, oy, ra, rb, phi=0, start=0, end=360, length=100, func=lines, ...)
{
        theta <- c(seq(radian(start), radian(end), length=length), radian(end))
        if (phi == 0) {
                func(ra*cos(theta)+ox, rb*sin(theta)+oy, ...)
        }
        else {
               x<- ra*cos(theta)
               <- rb*sin(theta)
                phi <- radian(phi)
                cosine <- cos(phi)
                sine <- sin(phi)
                func(cosine*x-sine*y+ox, sine*x+cosine*y+oy, ...)
        }
}

radian <- function(degree) {
        degree/180*pi
}