シミュレーションの章。
腎臓癌の腫瘍サイズと腫瘍ができてからの年数をシミュレーションで求めようという話。元ネタはこちら。
元々は軍人だった人が腎臓癌とわかって、腎臓癌が軍にいる間にできたものであればいろいろ援助が受けられるけれども、いまの大きさからすると軍にいるときにできたのか、退役後にできたのか推定してほしい、という話。
January 2009 Radiology, 250,137-144. からそれっぽい増殖速度を分布にする。ふたつの指数分布を混合した感じにする。
Pythonコードを読めばこんな感じになる。
pc <- 0.35
lam1 <- 0.79; lam2 <- 5
freqs <- c(0, 2, 31, 42, 48, 51, 52, 53)
n <- 53

x <- seq(-2, 7, by=0.01)
y <- ifelse(x<0, pc*(1-pexp(-x*lam2)), pc+(1-pc)*pexp(x*lam1))
xs <- seq(-1.5, 5.5, by=1)
plot(x, y, type="l", lwd=3, ylim=c(0, 1), xlab="RDT (volume doublings per year)", ylab="CDF")
points(xs, freqs/n)
legend("bottomright", legend=c("model", "data"), lwd=3, lty=c(1, -1), pch=c(-1, 1), merge=TRUE)
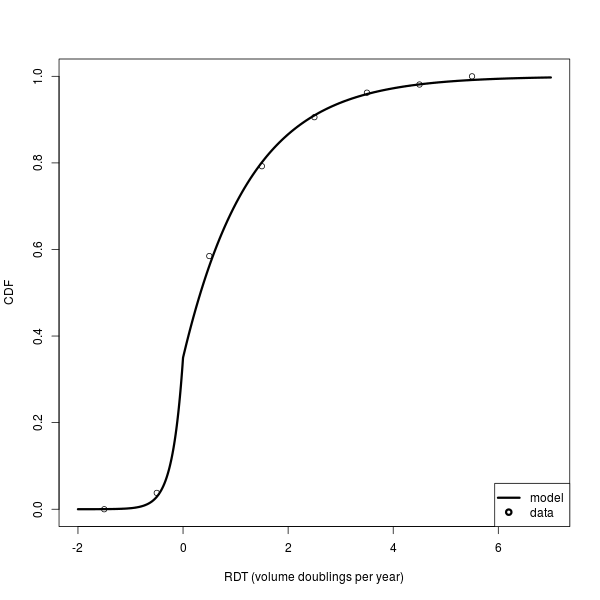
Python的コードをRにするとこんな感じ。
interval <- 3291         # 軍を退役したときと診断との期間 (日)
dt <- 811*3              # 径の測定値の倍増時間は体積の倍増時間x3
doublings <- interval/dt # 退役してからの倍増の回数
d1 <- 15.5               # 退役時の腫瘍の直径の大きさ (cm)
d0 <- d1/2^doublings     # 最初の半径の大きさ

d0 <- 0.1                  # 初期の径測定値を 0.1 cm と仮定する
d1 <- 15.5                 # 発見時
doublings <- log(d1/d0, 2) # 倍増の必要回数
dt <- interval/doublings   # 倍増時間
vdt <- dt/3                # 体積の倍増時間
rdt <- 365/vdt
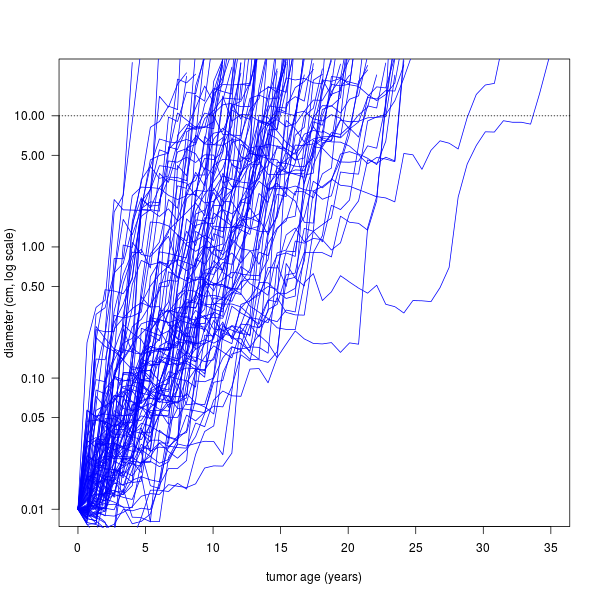
増殖のシミュレーションをするとこんな感じ。
d <- diff(c(y, 1))
d <- d/sum(d)
s0 <- 0.01
age <- 0
interval <- 0.67
vmax <- 20
niter <- 1000
s1 <- vector("list", niter)
for(i in seq(niter)){
	s0 <- 0.01
	age <- 0
	rdt_seq <- sample(x, prob=d, replace=TRUE)
	for(rdt in rdt_seq){ # この rdt_seq はわからん
		age <- c(age, tail(age, 1) + interval)
		initial <- tail(s0, 1)
		doublings <- rdt*interval
		final <- initial*2^doublings
		s0 <- c(s0, final)
		if(final > vmax) break
	}
	s1[[i]] <- list(s0=s0, age=age)
}

plot(s1[[1]]$age, s1[[1]]$s0, xlim=c(0, 35), ylim=c(s0[1], vmax), las=1, log="y", type="n", xlab="tumor age (years)", ylab="diameter (cm, log scale)")
for(i in seq(s1)){
	lines(s1[[i]]$age, s1[[i]]$s0, col="blue")
}
abline(h=10, lty=3)
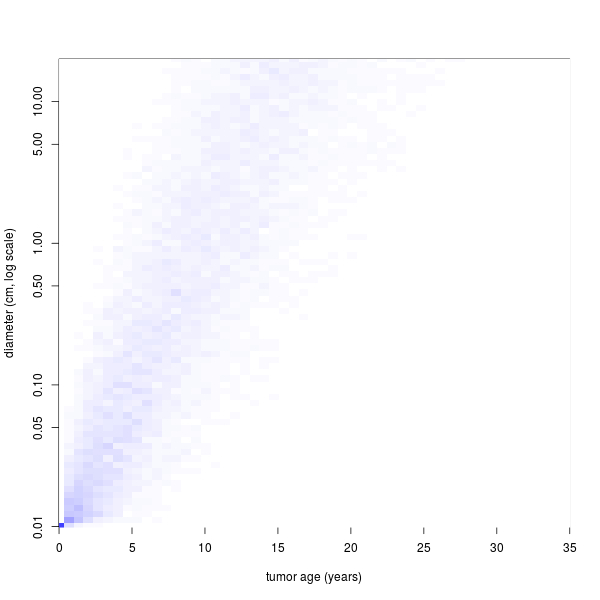
バケットにする。このあたりから図がなんか違う。
library(gplots)
f <- 10
s2 <- unlist(mapply(function(x) s1[[x]]$s0, seq(s1)))
a2 <- unlist(mapply(function(x) s1[[x]]$age, seq(s1)))
bucket <- round(f*log(s2))
mat <- table(a2, factor(bucket, min(bucket):max(bucket)))
mat <- sweep(mat, 2, colSums(mat), "/")
cols <- rev(grey(seq(0,1,length=1000)))
cols <- colorpanel(70, low="white", high="blue")
image(as.numeric(rownames(mat)), exp(as.integer(colnames(mat))/f), mat, col=cols, xlim=c(0, 35), ylim=c(0.01, vmax), log="y", xlab="tumor age (years)", ylab="diameter (cm, log scale)")
mat <- mat[, tail(colnames(mat), -which(colnames(mat) == round(f*log(s0[1])))+1)]
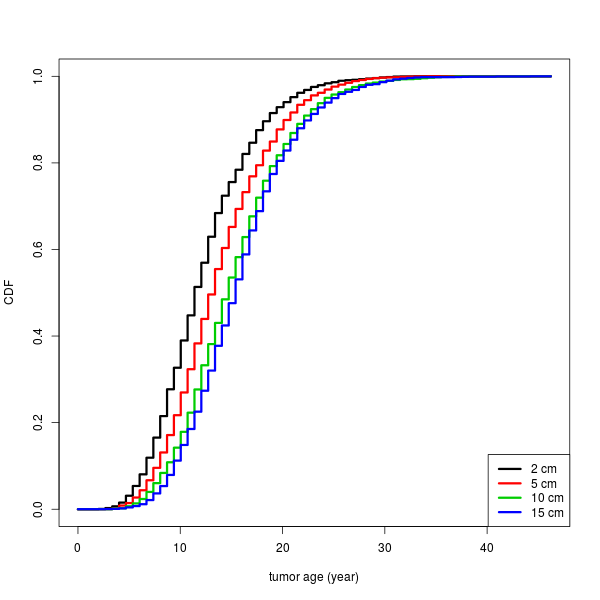
cm <- c(2, 5, 10, 15)
idx <- round(log(cm)*f)
y1 <- apply(mat[, match(idx, colnames(mat))], 2, cumsum)
matplot(as.numeric(rownames(mat)), y1, lwd=3, lty=1, type="s", xlab="tumor age (year)", ylab="CDF")
legend("bottomright", legend=paste(cm, "cm"), lwd=3, lty=1, col=seq(cm))
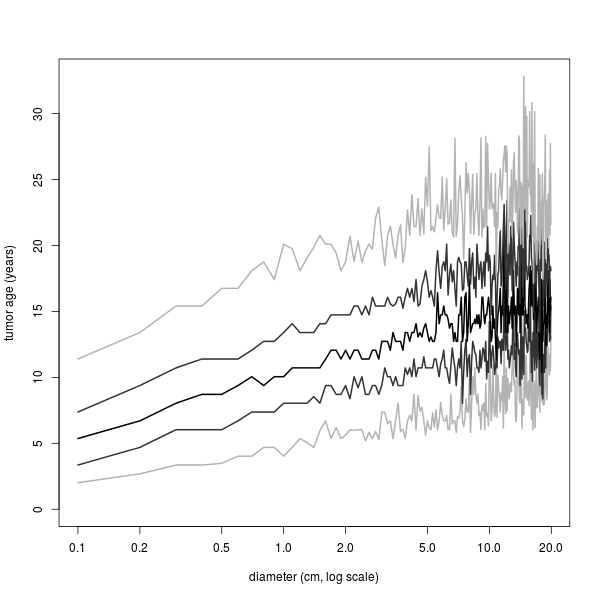
サイズに対する年齢の95%区間。図が全然違う。
qp <- c(5, 25, 50, 75, 95)/100
tmp <- tapply(a2[s2<vmax], round(s2, 1)[s2<vmax], quantile, qp)
xt <- as.numeric(names(tmp))
tmp <- t(matrix(unlist(tmp), nr=length(qp)))
cols <- grey(c(0.7, 0.2, 0, 0.2, 0.7))
matplot(xt, tmp, type="l", lwd=2, lty=1, log="x", col=cols, xlab="diameter (cm, log scale)", ylab="tumor age (years)")
