高次元での回転と疎行列

MikuHatsune2016-07-11

3次元物体を回転させたい。
2次元であれば回転行列は回転角\thetaを用いてR=\begin{pmatrix}\cos\theta&\sin\theta\\-\sin\theta&\cos\theta\end{pmatrix} と書ける。
高次元での回転ならば、正方対角行列(対角成分は1)Rについて、(i, i), (i, j), (j, i), (j, j) 成分をひらすら上のRで置換していけば、ある軸での回転を表す。
特に3次元では、x軸まわりに\alpha、y軸まわりに\beta、z軸まわりに\gamma 回転することを考えると、v=(x,y,z)を回転させて得られる座標V=(X,Y,Z)
^{t}V=\begin{pmatrix}\cos\gamma&\sin\gamma&0\\-\sin\gamma&\cos\gamma&0\\0&0&1\end{pmatrix}\begin{pmatrix}\cos\beta&0&-\sin\beta\\0&1&0\\\sin\beta&0&\cos\beta\end{pmatrix}\begin{pmatrix}1&0&0\\0&\cos\alpha&\sin\alpha\\0&-\sin\alpha&\cos\alpha\end{pmatrix}{^{t}v}
と表される。


これを疎行列でやる。疎行列自体の説明は飛ばして、実際に使ってみる
基本的な疎行列の形は、例えば対角成分だけ何か値があって他は0というような、
S=\begin{pmatrix}s_1&0&0&0\\0&s_2&0&0\\0&0&s_3&0\\0&0&0&s_4\end{pmatrix}
というものがまず思いつくやつである。ここで、s_iも行列だと思えば、例えばこれがxyz 座標に相当するとして、s_i=\begin{pmatrix}x_i&0&0\\0&y_i&0\\0&0&z_i\end{pmatrix} と考えれば、
S=\begin{pmatrix}x_1&0&0&&&&\\0&y_1&0&\dots&&0&\\0&0&z_1&&&&\\&\vdots&&\ddots&&\vdots&\\&&&&x_n&0&0\\&0&&\dots&0&y_n&0\\&&&&0&0&z_n\end{pmatrix}
というような対角ブロック行列ができる。
ブロックに相当する回転行列を持った、これまた疎行列を用意すれば、すべてが行列演算でできる。
しかし、xyz座標をベタに呼び出して計算したほうが速いっぽい…メモリサイズ的には疎行列のほうがよさそうなんだが。

rotate_polar <- function(xyz, alpha=pi/3, beta=pi/3, gamma=pi/3, sparse=FALSE){
  # angle alpha around x axis, beta y axis, and gamma z axis
  X <- matrix(c(cos(gamma), -sin(gamma), 0, sin(gamma), cos(gamma), 0, 0, 0, 1), nr=3)
  Y <- matrix(c(cos(beta), 0, sin(beta), 0, 1, 0, -sin(beta), 0, cos(beta)),     nr=3)
  Z <- matrix(c(1, 0, 0, 0, cos(alpha), -sin(alpha), 0, sin(alpha), cos(alpha)), nr=3)
  if (!sparse){
    res <- t(mapply(function(w) X %*% Y %*% Z %*% xyz[w,], seq(nrow(xyz))))
  } else {
    ij <- seq(nrow(g1)*3)
    M <- sparseMatrix(i=ij, j=ij, x=c(t(g1)))
    zeroX <- sparseMatrix(i=rep(1:(nrow(g1)*3), each=3), j=rep(1:(nrow(g1)*3), 3), x=as.numeric(X))
    zeroY <- sparseMatrix(i=rep(1:(nrow(g1)*3), each=3), j=rep(1:(nrow(g1)*3), 3), x=as.numeric(Y))
    zeroZ <- sparseMatrix(i=rep(1:(nrow(g1)*3), each=3), j=rep(1:(nrow(g1)*3), 3), x=as.numeric(Z))
    res <- matrix(rowSums(zeroX %*% zeroY %*% zeroZ %*% M), nc=3, byrow=TRUE)
  }
  return(res)
}
xyz <- matrix(rnorm(1000*3), nc=3)
# 疎行列にしてみる
system.time(rotate_polar(xyz, sparse=TRUE))
   ユーザ   システム       経過  
     0.257      0.000      0.258 
# 疎行列を使わずベタにfor loop で呼び出す
system.time(rotate_polar(xyz, sparse=FALSE))
   ユーザ   システム       経過  
     0.001      0.001      0.003 

rmarkdown とknitr による文書作成

markdown 形式のrmarkdown とknitr を使って、授業資料の作成および解析結果の報告、宿題の提出などやっている。
HTML にすることでrgl の3D プロットなども出せるので、3D データを扱っているときにもよさげ。
真面目にやるならpandoc をインストールしてrender して…というので初心者は挫折する可能性があるが、Rstudio ならばknitr ボタンをポチるだけでできる。
 
いくつかハマった箇所。
いい感じの見出しや目次をつけたいとき、一番上に書いておけばいい感じになる。

---
title: "Title"
author: "Author name"
date: "Any date such as created or presented date"
output:
  html_document:
    toc: true
    toc_depth: 4 #デフォルト値は2
    number_section: true #trueでナンバリング
---
Created at `r Sys.time()`.

 
rmarkdownのchunk オプションをまとめて書いておけば一括で変更できる。

```{r echo=FALSE, warning=FALSE, message=FALSE, comment=""}
knitr::opts_chunk$set(echo=TRUE, eval=FALSE, warning=FALSE, message=FALSE, comment="")
```

 
本文自体はmarkdown 記法にしたがってかく。例えば見出しにリンク付きハイライトを書いたとしても、目次では目次番号がHTML 内リンク、見出し文字がリンク先へリンク、となっている。
 
rgl は少し挙動がオカシイときがある。こちらを参考にオプションをセットし

```{r setup, eval=TRUE, echo=FALSE}
library(rgl)
knitr::knit_hooks$set(rgl = hook_webgl)
```

実際にplot3d を出力する部分はrgl=TRUE を設定すればよい。

```{r rgl=TRUE, eval=TRUE}
plot3d()
```

しかし、ubuntu が悪いのかrgl するデータ容量が大きすぎるのが悪いのか、chrome が悪いのか、結構な頻度で
You must enable Javascript to view this page properly.
と言われてhtml 上、表示されないことがある。windows に持っていくと見れることもある。
 
というわけでサンプル。.Rmd として保存して、render するかRstudio でknitr ボタンをポチる。

---
title: "Matrix and Gram-Schmidt orthonormalization process"
author: "@Med_KU"
date: "20160705"
output:
  html_document:
    toc: true
    toc_depth: 4 #デフォルト値は2
    number_section: true #trueでナンバリング
---
Created at `r Sys.time()`.

```{r echo=FALSE, warning=FALSE, message=FALSE, comment=""}
knitr::opts_chunk$set(echo=TRUE, eval=FALSE, warning=FALSE, message=FALSE, comment="")
```
```{r setup, eval=TRUE, echo=FALSE}
library(rgl)
knitr::knit_hooks$set(rgl = hook_webgl)
```
# [vector](https://en.wikipedia.org/wiki/Vector_space)
Vector is mathematically a set of [scalar](https://en.wikipedia.org/wiki/Scalar_(mathematics)). Vector has scalar values and direction.

R keeps data by *vector* structure. This is an essential form. This is defined by `c`.
The data made in R is called *object*.
```{r}
dat <- c(1, 2, 10, 5, 9, 291)
dat
```
You can access to i th element in the *vactor* by `dat[i]`.
```{r}
dat[4]
```
You can modify the *vector object* by adding or reducing its elemetns.
```{r}
c(dat, 4, 1, 5, 12312)
dat[-4]
```

You can sum/diff/multiply/divide the *vector* or each element between *vector*s.
```{r}
# define another vector
dat1 <- c(3, 13, 64, 11, 0, 4)
sum(dat)
dat[3] + dat[1]
dat + dat1

dat[1] - dat[2]
diff(dat)
dat - dat1

dat[1] * dat[5]
prod(dat)
dat * dat1

dat/dat1
```

# [Matrix](https://en.wikipedia.org/wiki/Matrix_(mathematics) "matrix") 

*Matrix* is a 2 dimensional data structure. *Matrix* keeps data as N length vectors by M columns.
This is called N by M (dimension) *matrix*. *Matrix object* is defined by `matrix`.
```{r}
mat <- matrix(dat, nr=2, nc=3)
mat
```
We can access the cell (or element) in the matrix by indicating indices. If you want to take the cell of second row and third column, write `mat[2, 3]`.
```{r eval=TRUE, echo=FALSE}
hoge <- matrix(c("", "", "↓", "→", "→", "i, j"), nr=2, byrow=TRUE)
```
```{r eval=TRUE, echo=TRUE, comment=""}
hoge
```

**Warning!!** Elements in a matrix object should be the same class. In upper case, "", arrows, and 'i, j' are *character*. If there are various type of objects, object type will be forced to transform into *complex* > *character* > *float* > *integer* automatically. To avoid this problem, *data.frame* is sometime used.

Arithmetic operators for *matrix* are two ways. One is an operator for each element. Like arithmetic operators for *vector* in upper cases, simple description of `+`, `-`, `*`, and `/` return results of each element.
That is, there are two matrices $A=\begin{pmatrix}a_{1,1}&a_{1,2}\\a_{2,1}&a_{2,2}\end{pmatrix}$ and $B=\begin{pmatrix}b_{1,1}&b_{1,2}\\b_{2,1}&b_{2,2}\end{pmatrix}$, `+` operator returns $A+B=\begin{pmatrix}a_{1,1}+b_{1,1}&a_{1,2}+b_{1,2}\\a_{2,1}+b_{2,1}&a_{2,2}+b_{2,2}\end{pmatrix}$
```{r echo=FALSE}
mat1 <- matrix(1:4, nr=2)
mat2 <- matrix(5:8, nr=2)
```
```{r}
mat1 + mat2
mat1 * mat2
```

On the other hand, `%*%` operator returns matrix mutiplication $AB=\begin{pmatrix}a_{1,1}b_{1,1}+a_{1,2}b_{2,1}&a_{1,1}b_{1,2}+a_{1,2}b_{2,2}\\a_{2,1}b_{1,1}+a_{2,2}b_{2,1}&a_{2,1}b_{1,2}+a_{2,2}b_{2,2}\end{pmatrix}$.

**Optional**: `%*%` operator for *vector* returns inner product.

# [Gram-Schmidt orthonormalization process](https://en.wikipedia.org/wiki/Gram%E2%80%93Schmidt_process)
Gram-Schmidt process is a method to orthonormalize a set of vectors in an inner product space. We generally suppose 3 dimensional space ($\mathbb{R}^3$) but it can be generalized in $\mathbb{R}^n$ space.

You replace a set of basis $\boldsymbol{v}=\{v_1, v_2, v_3\}$ with another set of basis $\boldsymbol{u}=\{u_1, u_2, u_3\}$. During the process, *normalization* and *orthogonalization* can be done.
Given *vector*s $\boldsymbol{x}$ and $\boldsymbol{y}$, these processes are performed as below.

***normalization***: *Normarization* means set length of *vector* (*norm*) 1. Length is difined as $|\boldsymbol{x}|$. That is, *normalization* returns $\boldsymbol{x}=\cfrac{\boldsymbol{x}}{|\boldsymbol{a}|}$.

***orthogonalization***: *Orthoganal* means crossing two *vector*s by 90 degree. Angle between *vector*s $\boldsymbol{x}$ and $\boldsymbol{y}$ is difined as $\theta$, and $\theta$ can be also defined by *inner product*

$cos{\theta}=\cfrac{\boldsymbol{x}\cdot \boldsymbol{y}}{|\boldsymbol{x}||\boldsymbol{y}|}$.

When $\theta=\pi$, $cos{\theta}=0$. That is $\boldsymbol{x}\cdot \boldsymbol{y}=0$.


Let's take a *vector* $\boldsymbol{a}$. This *vector* has three *vector*s `a1 <- c(1, 1, 1)`, `a2 <- c(1, -1, 2)`, and `a3 <- c(-1, 1, 3)` in itself. Data structure looks like *matrix*.
```{r eval=TRUE}
a <- cbind(c(1, 1, 1), c(1, -1, 2), c(-1, 1, 3))
```
```{r eval=TRUE, out.width=480, out.height=480, fig.width=7, fig.height=7}
# install.packages("scatterplot3d")
s <- scatterplot3d::scatterplot3d(t(cbind(0, a)), pch=16, xlab="x", ylab="y", zlab="z")
dt <- seq(0, 1, length=100)
for(i in seq(ncol(a))){
  s$points3d(t(outer(a[, i], dt)), cex=0.01, col=i+1)
}
```

```{r rgl=TRUE, eval=TRUE}
plot3d(t(cbind(0, a)), pch=16, xlab="x", ylab="y", zlab="z")
spheres3d(t(a), radius=0.05)
for(i in seq(ncol(a))){
  lines3d(rbind(0, a[, i]), lwd=2, col=i+1)
}
```

From *vector*s $a$, you want to get Gram-Schmidt *vector*s $u$. Gram-Schmidt process is performed as below.

1. STEP 1: $u_{1}=\cfrac{a_{1}}{|a_{1}|}$

2. STEP 2: $b_{2}=a_{2}-(a_{2}\cdot u_{1})u_{1}$, then $u_{2}=\cfrac{b_{2}}{|b_{2}|}$

3. STEP 3: $b_{3}=a_{3}-(a_{3}\cdot u_{1})u_{1}-(a_{3}\cdot u_{2})u_{2}$, then $u_{3}=\cfrac{b_{3}}{|b_{3}|}$

$b$ is a temporal objects.

Gram-Schmidt process is much major and famous algorithm. Someone has already implemented in R as a function.
[pracma](https://cran.r-project.org/web/packages/pracma/index.html) package has a function `gramSchmidt` to perform it. A precise result is $u_{1}=\cfrac{1}{\sqrt{3}}(1, 1, 1)$, $u_{2}=\cfrac{1}{\sqrt{42}}(1, -5, 4)$, and $u_{3}=\cfrac{1}{\sqrt{14}}(-3, 1, 2)$.
```{r echo=TRUE, eval=TRUE}
# install.packages("pracma")
library(pracma)
(a_g <- pracma::gramSchmidt(a))
```
```{r rgl=TRUE, eval=TRUE}
plot3d(t(cbind(0, a)), pch=16, xlab="x", ylab="y", zlab="z")
spheres3d(t(a), radius=0.05)
for(i in seq(ncol(a))){
  lines3d(rbind(0, a[, i]), lwd=2, col=i+1, lty=3)
}
spheres3d(t(a_g$Q), radius=0.05, col="yellow")
for(i in seq(ncol(a_g$Q))){
  lines3d(rbind(0, a_g$Q[, i]), cex=0.01, lwd=4, col=i+1)
}
```

# Assignment
1. Define any *vector* as you like.

2. Calculate mean of that *vector* by writing down the difinition of mean and using pre-implemented function in R.

3. Define 3 by 3 *matrix* $M$ as you like.

4. Calculate *matrix multiplication* $M^3$.

5. Perform Gram-Schmidt process of $M$. As shown in above, you need 3 steps.

6. Check whether STEP 5 is performed successfully, that is, compute *inner product* of the basis of Gram-Schmidt $M$ and length of it (This procedure needs multiplication and summation. These functions are in R.).

3次元空間の補間 kriging

MikuHatsune2016-07-02

3次元空間の補間 interpolation をしたい。
空間統計学GIS ではkriging と呼ばれる手法を用いている。
interpolation 自体はakima, kriging はpracma, kriging パッケージでできる。
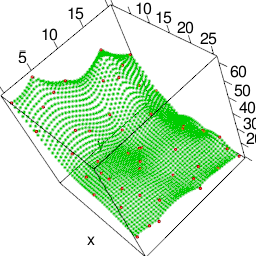
pracma のkriging は、補間して推定したい点をひとつ入れれば、それに対応するZ軸の値を返す仕様で、kriging のkriging はある範囲のすべての補間推定値を返す仕様っぽい。


本当はこれくらい複雑なデータにやりたいけれども、うまく補間幅を選ばないとデータ容量で爆発する。

library(akima)
library(rgl)
data(akima)
# data
rgl.spheres(akima$x,akima$z , akima$y,0.5,color="red")
rgl.bbox()
# bivariate linear interpolation
# interp:
akima.li <- interp(akima$x, akima$y, akima$z,
                   xo=seq(min(akima$x), max(akima$x), length = 100),
                   yo=seq(min(akima$y), max(akima$y), length = 100))
# interp surface:
rgl.surface(akima.li$x,akima.li$y,akima.li$z,color="green",alpha=c(0.5))
# interpp:
akima.p <- interpp(akima$x, akima$y, akima$z,
                   runif(200,min(akima$x),max(akima$x)),
                   runif(200,min(akima$y),max(akima$y)))
# interpp points:
rgl.points(akima.p$x,akima.p$z , akima.p$y,size=4,color="yellow")
# bivariate spline interpolation
# data
rgl.spheres(akima$x,akima$z , akima$y,0.5,color="red")

library(pracma)
library(kriging)
# pracma package でやる
## Interpolate the Saddle Point function
f <- function(x) x[1]^2 - x[2]^2 # saddle point function
set.seed(8237)
n <- 36
x <- c(1, 1, -1, -1, runif(n-4, -1, 1)) # add four vertices
y <- c(1, -1, 1, -1, runif(n-4, -1, 1))
u <- cbind(x, y)
v <- numeric(n)
for (i in 1:n) v[i] <- f(c(x[i], y[i]))

xy <- c(0.3, 0.3)
pkr <- pracma::kriging(u, v, xy)
plot3d(cbind(u, v))
spheres3d(matrix(c(xy, pkr), nr=1), radius=0.05, col=2)

# kriging package のほうで同じことをやる
kkr <- kriging::kriging(akima$x, akima$y, akima$z, lags=10, pixels=50)
plot3d(kkr$map, col=3)
spheres3d(akima$x, akima$y, akima$z, radius=0.5, col=2)

Ricci flow

MikuHatsune2016-06-10

読んでる。Comput Vis Image Underst. 2013 Sep 1;117(9):1107-1118.
Ricci flow という、Willmore flow とはまた違う条件で微分幾何学的物体変換を行う。
その前に下準備。
 
以前やった(離散)ガウス曲率は、1-ring下の三角形の角度と、A_{mixed}と呼ばれる傘の面積で計算していたが、これはMeyer method というらしい。
本来は、ガウス曲率は角度だけで計算できて
K_i=2\pi-\sum_i\theta_i
となる。しかし、この場合は、論文の図にもあるけれども、理想的な球体のうえにランダムに点を発生させて三角形を作った時に、ガウス曲率の濃淡ができてしまう。というわけで、疎密に合わせてガウス曲率を補正したい。
というわけでA_{mixed}で割る、らしい。
 
半径r の理想的な球を作っているので、ガウス曲率は\frac{1}{r^2}=1である。
ほとんどが1の周辺に分布している。

 
1からかけ離れたガウス曲率をもつ頂点をプロットした。赤が高いガウス曲率、青が低い。
ズームしてみると、すごい鋭角な三角形をもつ頂点が、低いガウス曲率になっている様子。
計算はあっているようである。

 
理想的な球を作り、点を配置し、三角形を作る。

library(rgl)
library(onion)
my.sphere.tri.mesh <- function(n.psi=30){
  thetas <- list()
  psis <- seq(from=-pi/2,to=pi/2,length=n.psi)
  #psis <- sort(runif(n.psi, min=-pi/2, max=pi/2))
    d.psis <- psis[2]-psis[1]
    hs <- sin(psis)
    rs <- sqrt(1-hs^2)
    ls <- 2*pi*rs
    n.thetas <- floor(ls/d.psis)
    thetas[[1]] <- c(2*pi)
    for(i in 2:(n.psi-1)){
        thetas[[i]] <- seq(from=0,to=2*pi,length=n.thetas[i]+1)
        thetas[[i]] <- thetas[[i]][-(n.thetas[i]+1)]
    }
    thetas[[n.psi]] <- c(2*pi)
    sapply(thetas,length)

    bridge <- list()
    for(i in 1:(n.psi-1)){
        a <- c(thetas[[i]],2*pi)
        b <- c(thetas[[i+1]],2*pi)
        bridge[[i]] <- matrix(c(1,1),1,2)
        loop <- TRUE
        while(loop){
            n.r <- nrow(bridge[[i]])
            id.a <- bridge[[i]][n.r,1] + 1
            id.b <- bridge[[i]][n.r,2] + 1
            if(id.a > length(thetas[[i]]) & id.b > length(thetas[[i+1]])){
                if(id.a-1!=1 & id.b-1!=1){
                    bridge[[i]] <- rbind(bridge[[i]],c(1,id.b-1))
                }

                loop <- FALSE
            }else{
                if(id.a > length(thetas[[i]])){
                    tmp <- c(id.a-1,id.b)
                }else if(id.b > length(thetas[[i+1]])){
                    tmp <- c(id.a,id.b-1)
                }else{
                    if(a[id.a] < b[id.b]){
                        tmp <- c(id.a,id.b-1)
                    }else{
                        tmp <- c(id.a-1,id.b)
                    }
                }
                bridge[[i]] <- rbind(bridge[[i]],tmp)
            }
        }
    }
    xyz <- matrix(0,0,3)
    edge <- matrix(0,0,2)
    triangles <- matrix(0,0,3)
  n.triangles <- rep(0,n.psi-1)
    for(i in 1:n.psi){
        n.r <- nrow(xyz)
        if(i > 1){
            pre <- (n.r-length(thetas[[i-1]])+1):n.r
            post <- (n.r+1):(n.r+length(thetas[[i]]))
            edge <- rbind(edge,cbind(post,c(post[-1],post[1])))
            br <- bridge[[i-1]]
            new.edge <- cbind(pre[br[,1]],post[br[,2]])
            edge <- rbind(edge,new.edge)
            tmp.tri <- cbind(new.edge,rbind(new.edge[-1,],new.edge[1,]))
            tmp <- apply(tmp.tri,1,unique)
            triangles <- rbind(triangles,t(tmp))
      n.triangles[i-1] <- length(tmp[1,])
        }
        psi <- psis[i]
        theta <- thetas[[i]]
        xyz <- rbind(xyz,cbind(cos(psi) * cos(theta),cos(psi)*sin(theta),sin(psi)))

    }
    return(list(xyz=xyz,edge=edge,triangles=triangles,n.psi=n.psi,thetas=thetas,n.triangles=n.triangles))
}
knit_hooks$set(rgl = hook_rgl)
n.psi <- 25
sp.mesh <- my.sphere.tri.mesh(n.psi)
spxyz <- sp.mesh$xyz
apply(spxyz^2,1,sum)
xx <- 0.8
yy <- 0.1
large.xy1 <- which(spxyz[,1]>xx & spxyz[,2]<=yy)
large.xy2 <- which(spxyz[,1]>xx & spxyz[,2]>yy)

spxyz[large.xy1,1] <- xx + ((spxyz[large.xy1,1]-xx)*10)^2
spxyz[large.xy2,1] <- xx + ((spxyz[large.xy2,1]-xx)*10)^2
spxyz[large.xy2,2] <- yy + ((spxyz[large.xy2,1]-yy)*10)^5
plot3d(spxyz)
segments3d(spxyz[c(t(sp.mesh$edge)),])
mesh.tri <- tmesh3d(t(spxyz),t(sp.mesh$triangles),homogeneous=FALSE)

# 打点して
plot3d(sp.mesh$xyz)
# 三角形メッシュオブジェクトを作り
mesh.tri <- tmesh3d(t(sp.mesh$xyz),t(sp.mesh$triangles),homogeneous=FALSE)
# 三角形を灰色で塗る
shade3d(mesh.tri,col="gray")

四元数でごそごそしていたので、ガウス曲率の計算に四元数を入力する仕様になっている。

# cumpute Gaussian curvature of j_th vertex
# input: index of vertices of quanterion vertices object
gaussian_curvature <- function(j, vertices, faces.v){
  #for(j in seq(n_vertices)){
    plane <- t(faces.v[, apply(faces.v==j, 2, any)])
    # shuffle the order of summation of triangle areas
    p <- p1 <- 1 # start
    s <- c(j, setdiff(plane[p,], j)[1]) # 2nd vertex
    p1 <- c(p1, setdiff(which(apply(plane == tail(s, 1), 1, any)), p))
    while(p < nrow(plane) - 1){
      s <- c(s, setdiff(plane[tail(p1, 1),], s))
      p1 <- c(p1, which(sapply(apply(plane, 1, setdiff, s), length) == 1)[2])
      p <- p + 1
    }
    plane <- plane[p1,] # ordered sequentially

    circum_mat <- matrix(1, 3, 3)
    diag(circum_mat) <- -1
    theta_j <- rep(0, nrow(plane))
    circumcenter <- matrix(0, nrow(plane), 3)
    for(p in seq(nrow(plane))){
      hogemat <- t(as.matrix(vertices[plane[p,]])[-1,])
      rname <- plane[p,]
      e12 <- sweep(hogemat[!(rname %in% j),], 2, hogemat[ (rname %in% j),], "-")
      theta_j[p] <- acos( e12[1,] %*% e12[2,]/prod(sqrt(rowSums(e12^2))) )
      if(theta_j[p] < pi/2){ # non-obtuse angle compute circumcenter point
        abc <- mapply(function(k) sum(apply(hogemat[c(k%%3+1, (k+1)%%3+1),], 2, diff)^2), seq(3))
        # abc <- rowSums(rbind(apply(e12, 2, diff), e12)^2)
        abc2 <- circum_mat %*% abc * abc
        circumcenter[p,] <- colSums(diag(c(abc2)) %*% hogemat)/sum(abc2)
        # circumcenter <- (abc2[1]*hogemat[1,] + abc2[2]*hogemat[2,] + abc2[3]*hogemat[3,])/sum(abc2)
      } else { # obtuse angle
        circumcenter[p,] <- colSums(hogemat[!(rname %in% j),])/2 # center point
      }
    }
    mat <- sweep(circumcenter, 2, as.numeric(vertices[j])[-1], "-") # vector from vertex j_th
    n <- nrow(circumcenter)
    Amixed <- mapply(function(k) sqrt(prod(rowSums(mat[c(k, k%%n+1),]^2)) - (mat[k,]%*%mat[k%%n+1,])^2) / 2, seq(n))
    Gcurvature <- (2*pi - sum(theta_j))/sum(Amixed, na.rm=TRUE)
  #}
  return(Gcurvature)
}

# すべての頂点について計算
b <- mapply(function(j) gaussian_curvature(j, vertices, faces.v), seq(length(vertices)))
cut0 <- cut(b, quantile(b, c(0, 0.02, 0.98, 1)))
cols <- bluered(length(levels(cut0)))[cut0]

plot3d(mesh.tri, type="dits", axes=FALSE, xlab="", ylab="", zlab="")
shade3d(mesh.tri, col="grey")
wire3d(mesh.tri)
spheres3d(t(mesh.tri$vb), col=cols, radius=0.02)

3次元オブジェクトをグラフにしてみる

MikuHatsune2016-06-08

平均曲率を用いて、3次元オブジェクトの表面を色付けした。

凹んでいるところは赤、出っ張っているところは緑になっている。
 
いま、同じ色でひと続きになっている領域を仲間分けして、なおかつ、隣り合う領域がどうなっているかを調べたい。
ある頂点と、その頂点を含む三角形(1-ring)を選び、それに隣り合っている三角形をすべて、再度抽出する。
このとき、既に選ばれた三角形たちは、重複して抽出すると計算に時間がかかるので、適宜除く。

# 球面に色を付けた時、同じ色が付いている閉じた領域をチェックする
K0 <- NULL
for(k0 in 1:nrow(v1[[i]]$f)){
  if( !any(mapply(function(z) k0 %in% z, K0)) ){ # いままでのK に kが含まれていなかったら新規のtriangle
    print(paste("Processing", k0))
    k <- k0
    foo0 <- which(mapply(function(x) any(v1[[i]]$f[x,] %in% v1[[i]]$f[k,]), seq(nrow(v1[[i]]$f))))
    foo1 <- foo0[cols[foo0] == cols[k[1]]] # k の三角形と同じ色をもって隣り合っている三角形たち
    #plot3d(bun.v, type="n", axes=FALSE, xlab="", ylab="", zlab="")
    #shade3d(mesh.tri, col=rep(cols, each=3))
    #rgl.viewpoint(10, 30, zoom=0.7)
    m2 <- tmesh3d(t(v1[[i]]$v), t(v1[[i]]$f[foo1,]), homogeneous=FALSE)
    #wire3d(m2)
    K <- list(k, foo1)
    while( !all(K[[length(K)]] %in% K[[length(K)-1]]) ){
      k <- setdiff(K[[length(K)]], K[[length(K)-1]])
      foo0 <- which(mapply(function(x) any(v1[[i]]$f[x,] %in% v1[[i]]$f[k,]), seq(nrow(v1[[i]]$f))))
      foo1 <- foo0[cols[foo0] == cols[k[1]]]
      K <- c(K, list(foo1))
      #open3d()
      #plot3d(bun.v, type="n", axes=FALSE, xlab="", ylab="", zlab="")
      #shade3d(mesh.tri, col=rep(cols, each=3))
      m <- v1[[i]]$f[setdiff(K[[length(K)]], K[[length(K)-1]]),]
      m2 <- tmesh3d(t(v1[[i]]$v), t(v1[[i]]$f[foo1,]), homogeneous=FALSE)
      #points3d(matrix(v1[[i]]$v[m,], nc=3))
      #texts3d(matrix(v1[[i]]$v[m,], nc=3), texts=unique(c(v1[[i]]$f[k,])))
      #wire3d(m2, col=4)
    }
    K1 <- sort(unique(unlist(K)))
    K0 <- c(K0, list(K1))
  }
}

隣接する三角形が広がっていく様子。最前線しかプロットしていない。

すべての隣り合う三角形をプロットした図。

 
いま、ひと続きになっている領域をメッシュで色塗りしたが、このふたつの紫、水色の領域は隣り合っている。


隣り合う領域をadjacent matrix として、グラフ化。
背中の広い範囲の緑、首まわりの赤がおおきなノードとして表現される。赤いノードからは顔、耳2つが隣接していて、それもノードとして出ている。
ノードの大きさは、対応する領域の面積としている。
グラフ構造に落とせれば、ノードの密度や、ネットワーク解析を応用してそういう統計量もとれる。

# K0 は同じ色で塗られるtriangle のひとつづきの領域
# 隣り合う領域を探す
V0 <- mapply(function(z) unique(c(v1[[i]]$f[z,])), K0) # 含まれる頂点たち
adj_mat <- mapply(function(z2) mapply(function(z1) any(z2 %in% z1)+0, V0), V0)
g0 <- graph.adjacency(adj_mat, mode="undirected", diag=FALSE)
V(g0)$size <- mapply(function(z) sum(area0[[i]][z,]), K0) * 10
V(g0)$color <- mapply(function(z) cols[z[1]], K0)
plot(g0)

方向ベクトルと平面の内分点

MikuHatsune2016-06-03

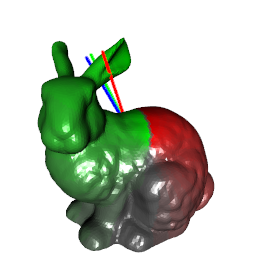
とある3D オブジェクトであるうさぎを貫くベクトルがあるとする。
ベクトルは極座標表示なので、中心からある程度伸ばして、そしてxyz 座標に変換する。
うさぎ自体はmesh3d オブジェクトで、もともとは頂点オブジェクト bun.v, エッジオブジェクト bun.f からできたものとする。

library(cwhmisc)
pol <- c(1, 1.475076, 1.970379) # 極座標
xyz <- t(mapply(toXyz, r=seq(0, 0.9, length=300), theta=pol[2], phi=pol[3])) # 直交座標

mesh.tri <- tmesh3d(t(bun.v), t(bun.f), homogeneous=FALSE)
plot3d(bun.v, type="n", axes=FALSE, xlab="", ylab="", zlab="")
shade3d(mesh.tri)
points3d(xyz, col=4)


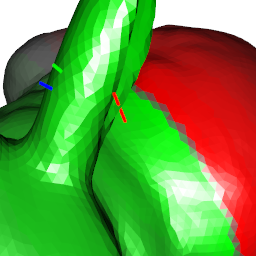
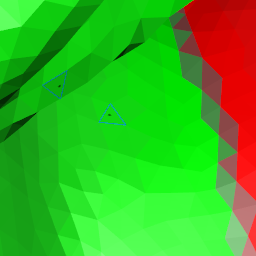
いま、ベクトルが貫いている三角形を取り出したい。というのも、ベクトルと三角形の交点である、三角形表面上の点の動きを追いたいと思っているから。
はじめに、極座標とxyz 座標の変換は
\begin{pmatrix}x\\y\\z\end{pmatrix}=\begin{pmatrix}r\sin{\theta}\cos{\phi}\\r\sin{\theta}\sin{\phi}\\r\cos{\theta}\end{pmatrix}
\theta\phiは決まっているので、rが動いて三角形を貫く。これを決めたい。
 
一方、ベクトルが三角形を点Pで貫くとするならば、三角形を構成するベクトル(v_1,v_2,v_3)により
P=av_1+bv_2+cv_3とかける。ただし、Pは三角形の内分点なので、a+b+c=1,\hspace{3}a>0,b>0,c>0 である。
また、空間上の平面の方程式は
\alpha X+\beta Y+\gamma Z+\delta=0
と書ける。3点だと変数4つは解けないが、ある文字で固めれば
\alpha X+\beta Y+\gamma Z+1=0
というような形に持っていける。これで、3点で決まる平面上にベクトルのさきっちょが乗るようには解ける。
 
次に、P=av_1+bv_2+cv_3 と書けるように(a,b,c)の組を決める。これも、Pが三角形に乗っていて(v_1,v_2,v_3) で表せられることと、極座標ベクトルで表せられることを方程式で解けば出る。
このとき、(v_1,v_2,v_3) で表現しているから、内分点の前提を満たしているa>0,b>0,c>0の組だけ採用する。
スクリプトではなぜかr<0も採用されていたので、(v_1,v_2,v_3) に対してすべて同方向(なす角が180度以下)を拾った。
 

norm_sph <- c(sin(pol[2])*cos(pol[3]), sin(pol[2])*sin(pol[3]), cos(pol[2])) # 極座標ベクトル
abc <- mapply(function(i){
    hoge_tri <- bun.v[bun.f[i,],] # bun.f は三角形を構成するvertex のID が入っている。
                                  # つまり、ある三角形をなす3つの頂点の座標を得る。
    Rad <- 1/sum(base::solve(hoge_tri, rep(-1, 3)) * norm_sph) # 平面の方程式
    abc <- -base::solve(t(hoge_tri), Rad*norm_sph)             # abc を求める
    if( all(abc > 0) & colSums(abc*hoge_tri)%*%norm_sph > 0) colSums(abc*hoge_tri)
  }, seq(nrow(bun.f)))
triangle_points <- do.call(rbind.data.frame, abc)
colnames(triangle_points) <- NULL
triangle_points

points3d(triangle_points, col=4)
# ほしい三角形だけかく
m2 <- tmesh3d(t(bun.v), t(bun.f[sapply(abc, length)>0,]), homogeneous=FALSE)
wire3d(m2, col=4)


総当りでなんとかできるけれども、三角形の数が多くなれば計算オーダーが増えるので、a+b+c=1,\hspace{3}a>0,>0,c>0の条件をうまくいれて線形計画法的に解きたかったけどゴリ押しした。
 
追記
疎行列の対角成分に3x3 行列、つまり三角形を構成するベクトルを納めて、疎行列のまま線形代数的に解けば早い。
ただし、これは3つのベクトルの組で表した場合のパラメータ表示が求まるだけなので、三角形平面に乗っている(和が1)なのは別途、もう一回疎3つ組ベクトルだけ取り出して計算する。

v <- c(1, 1, 1)
library(Matrix)
n <- ncol(g$it)
i0 <- c(mapply(function(z) rep((3*z-2):(z*3), 3), 1:n))
j0 <- rep(1:(n*3), each=3)
sm <- sparseMatrix(i=i0, j=j0, x=c(g$vb[-4, g$it]))
res <- matrix(solve(sm, rep(v, n)), nr=3)

球状の物体をメルカトル図法で2次元にする

MikuHatsune2016-05-23

物体をいじって球にしている。いま、球になった物体があるとして、これを2次元平面に展開して眺めたい。
地球儀が世界地図になるメルカトル図法みたいな感じ。
 
もとのうさぎは、各頂点の(離散)ガウス曲率にしたがって色付けしてある。正なら赤、0近くは灰色、負は緑である。

足の裏は平らなのでほぼ0、背中も0。凸凹に応じて赤か緑である。しっぽはでっぱっているので赤、しっぽの付け根は緑である。

 
球に位相変換したものである。正球に近づくと、半径がRとすれば、ガウス曲率はすべての頂点で\frac{1}{R^2}に近づく。
色をつけるとほとんど1色になるが、もとの頂点と辺で作られる三角形表面がどこに移動しているかを示すため、最初のうさぎの形に応じて色付けしたガウス曲率をそのまま維持しておくとする。
すると、球になったときに、もともと足の裏だったところとか、しっぽだったところの名残がわかりやすい。


メルカトル図法への展開は、sphereplot もしくはSphericalCubatureパッケージを使う。使ってみた感触としてはsphereplot のほうが手軽な感じがする。

library(sphereplot)
xyz <- c(1, 1, 0) # xyz 座標
s <- car2sph(x=xyz[1], y=xyz[2], z=xyz[3], deg=FALSE)

library(SphericalCubature)
rect2polar(xyz)

 
座標データをshpereplot を使って緯度・経度にする。半径はデフォルトでは地球の半径になっているので、球に変換したオブジェクトの半径にする。
半径は体積から計算できる。

s <- car2sph(x=xyz[1], y=xyz[2], z=xyz[3], deg=FALSE)
merc2d <- mercator(s[,1:2], r=ra)

 
メルカトル図法をやると、3次元である球を2次元展開しているから、地球儀でいうところの北極や南極が間延びする。
しかも、どうしても連続な地面が分断してしまう。
この状態で、もとの三角形を再構成すると、こんな感じのクッソ長い三角形ができる。

 
間延びするのは北極と南極で、三角形の辺がはんぱなく伸びるから、あまりにも長い辺を持つ三角形は、塗るのをやめよう、という感じにしておくと、まあ、どうにかなる。
すべての三角形の辺の長さを計算しておく。いくらか重複があるけど気にしない。

# 距離の分布
di <- c(mapply(function(x) c(dist(merc2d[ new_v$f[x,], ])), seq(nrow(new_v$f))))
dq <- quantile(di, 0.99) # 99% の三角形は塗る

plot(merc2d, pch=16, cex=0.03)
for(j in 1:nrow(new_v$f)){
  tmp <- merc2d[ new_v$f[j, c(1:3,1)],]
  if( all(c(dist(tmp[1:3,])) < dq) ){
    polygon(tmp, col=cols[j], border=NA)
  }
}

library(MASS)
x0 <- merc2d[,1]; y0 <- merc2d[, 2]
kd <- kde2d(x0, y0, c(bandwidth.nrd(x0), bandwidth.nrd(y0)), n=1000)
contour(kd, xlab="latitude",ylab="longitude", add=TRUE, col="blue", lwd=4)

 
三角形の面積でも判定しようと思った。平面上の3点(x_1, y_1), (x_2, y_2), (x_3, y_3)で囲まれる三角形の面積A
\begin{align}A&=|(x_2-x_1)(y_3-y_1)-(x_3-x_1)(y_2-y_1)|/2\\&=\begin{vmatrix}x_2-x_1 & x_3-x_1 \\ y_2-y_1 & y_3-y_1\end{vmatrix}/2\end{align}
で表されるが、辺の距離ほど分別能がよくなかったので不採用。

# 三角形の面積の分布
ai <- mapply(function(x){abs(det(merc2d[ new_v$f[x,][1:2],] - merc2d[ new_v$f[x,][3],]))/2}, seq(nrow(new_v$f)))


カーネル密度かぶせてみたりとか。