巷で話題のRstanをインストールだけしておいた。
OSはubuntu 12.04 LTS.
なんか困ったらhttp://heartruptcy.blog.fc2.com/かAnalyze IT.を見れば問題ない。
# 依存関係
install.packages("inline")
install.packages("Rcpp")
install.packages("coda") # あると便利

# Rstan
options(repos = c(getOption("repos"), rstan = "http://wiki.rstan-repo.googlecode.com/git/"))
install.packages('rstan', type = 'source')
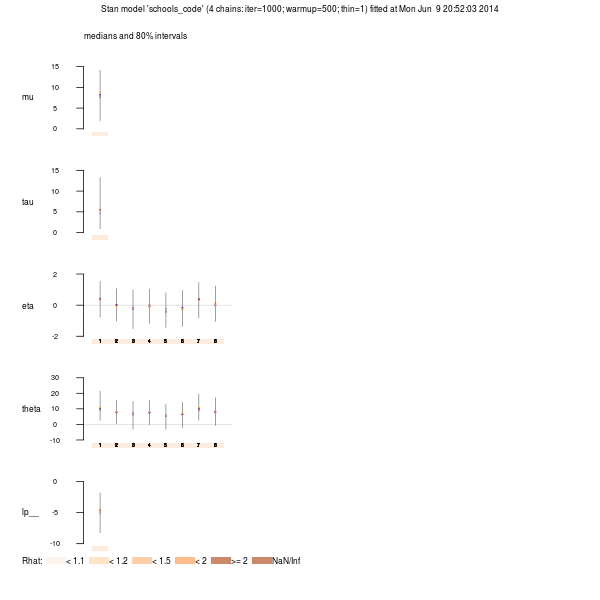
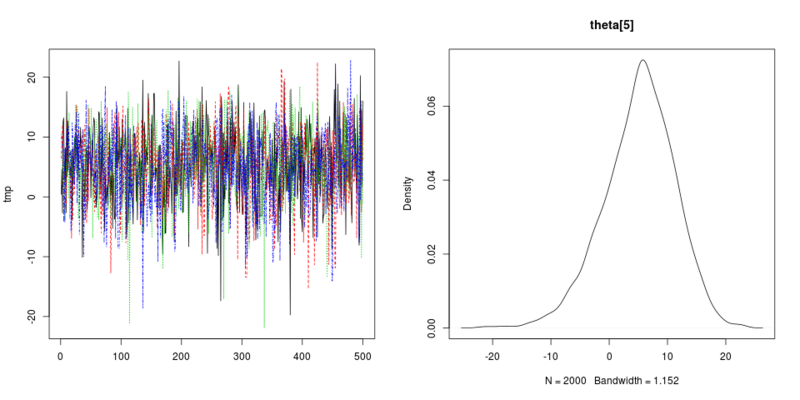
Eight Schoolsの例をとりあえずやってみる。計算結果のstanfitクラスオブジェクトのデフォルトプロットでは味気ないので、収束の様子がわかりやすいプロットをここもしくはここからパクる。ggplot系を使わない人なので普通のプロットでゴリ押し。
library(rstan)
library(coda)
schools_code <- '
  data {
    int<lower=0> J; // number of schools
    real y[J]; // estimated treatment effects
    real<lower=0> sigma[J]; // s.e. of effect estimates
  }
  parameters {
    real mu;
    real<lower=0> tau;
    real eta[J];
  }
  transformed parameters {
    real theta[J];
    for (j in 1:J)
      theta[j] <- mu + tau * eta[j];
  }
  model {
    eta ~ normal(0, 1);
    y ~ normal(theta, sigma);
  }
'

schools_dat <- list(J = 8,
                    y = c(28,  8, -3,  7, -1,  1, 18, 12),
                    sigma = c(15, 10, 16, 11,  9, 11, 10, 18))
fit <- stan(model_code = schools_code, data = schools_dat, iter = 1000, chains = 4)
fit.coda <- mcmc.list(lapply(1:ncol(fit),function(x) mcmc(as.array(fit)[,x,])))
plot(fit)
i <- 15
par_name <- fit@sim$fnames_oi[i]
tmp <- mapply(function(x) x[, i], fit.coda)
par(mfrow=c(1, 2))
matplot(tmp, type="l")
plot(density(tmp), main=par_name)

# 事後分布
# coda は読み込ませない
library (reshape)
library (ggplot2)
post   <- extract(fit, permuted = FALSE)
m.post <- melt(post)
graph  <- ggplot (m.post, aes(x = value))
graph  <- graph + geom_density() + facet_grid(. ~ parameters, scales = "free") + theme_bw() # facet_wrapのほうがいいかも
plot(graph)

