gganatogram を使って人体を描く

MikuHatsune2018-09-11

こんなのを見かけた。

github
 
ggplot で人体を描いて、臓器やその臓器に与えられたパラメータに応じた色を描いてくれるらしい。

devtools::install_github("jespermaag/gganatogram")

library(ggplot2)
library(ggpolypath)
library(gganatogram)
library(dplyr)
library(gridExtra)

gganatogram(data=hgMale_key, fillOutline='#a6bddb', organism='human', sex='male', fill="colour") + theme_void()


hgMake_key にはデフォルトで入っている臓器とタイプ分け、タイプに応じた色が入っている。

                       organ           type    colour     value
1                bone marrow          other   #41ab5d  3.465121
2             frontal cortex nervous system    purple 16.279637
3          prefrontal cortex nervous system    purple 19.914552
4  gastroesophageal junction      digestion    orange  1.007031
5                     caecum      digestion    orange  1.805996
6                      ileum      digestion    orange  9.911434
7                     rectum      digestion    orange 19.989139
8                       nose          other   #41ab5d 12.858249
9                     tongue      digestion    orange  8.574843
10                     penis          other   #41ab5d 15.586977
11             nasal pharynx          other   #41ab5d 18.635302
12               spinal cord nervous system    purple 10.512042
13                    throat      digestion    orange 17.288282
14                 diaphragm    respiratory steelblue 10.941339
15                     liver      digestion    orange  5.335311
16                   stomach      digestion    orange  8.305132
17                    spleen      digestion    orange 16.728927
18                  duodenum      digestion    orange  4.879619
19              gall bladder      digestion    orange 14.012052
20                  pancreas      digestion    orange 10.786245
21                     colon      digestion    orange 16.293596
22           small intestine      digestion    orange  4.601459
23                  appendix          other   #41ab5d 12.857249
24           urinary bladder      digestion    orange  2.420635
25                      bone          other   #41ab5d  1.624326
26                 cartilage          other   #41ab5d 17.913499
27                 esophagus      digestion    orange 19.941666
28                      skin          other   #41ab5d  2.310034
29                     brain nervous system    purple 16.736891
30                     heart    circulation       red  8.383394
31                lymph_node    circulation       red 16.455134
32           skeletal_muscle          other   #41ab5d 19.707006
33                 leukocyte    circulation       red 10.528939
34             temporal_lobe nervous system    purple 16.984754
35          atrial_appendage          other   #41ab5d 17.094688
36           coronary_artery    circulation       red 13.996476
37               hippocampus nervous system    purple 15.832699
38              vas_deferens nervous system    purple 17.723010
39           seminal_vesicle          other   #41ab5d  1.047456
40                epididymis          other   #41ab5d 13.174310
41                    tonsil      digestion    orange  6.264270
42                      lung    respiratory steelblue 13.708475
43                   trachea      digestion    orange  1.825725
44                  bronchus    respiratory steelblue 14.416962
45                     nerve nervous system    purple 17.915368
46                    kidney      digestion    orange 15.225223

46臓器各々やろうと思ったけどfacet_grid がorgan をなぜか受け付けてくれないのでtype 別にプロットする。

gganatogram(data=hgMale_key, fillOutline=grey(0.9), organism='human', sex='male', fill="colour") +
  theme_void() +
  theme(title=element_text(size=24,face="bold")) +
  facet_grid(. ~ type)

ggsave("gganatogram.png", width=5, height=2)


実際には、正常と病気で比較したいだろうから、例では癌として適当な図を作っている。

compareGroups <- rbind(data.frame(organ = c("heart", "leukocyte", "nerve", "brain", "liver", "stomach", "colon"), 
  colour = c("red", "red", "purple", "purple", "orange", "orange", "orange"), 
 value = c(10, 5, 1, 8, 2, 5, 5), 
 type = rep('Normal', 7), 
 stringsAsFactors=F),
 data.frame(organ = c("heart", "leukocyte", "nerve", "brain", "liver", "stomach", "colon"), 
  colour = c("red", "red", "purple", "purple", "orange", "orange", "orange"), 
 value = c(5, 5, 10, 8, 2, 5, 5), 
 type = rep('Cancer', 7), 
 stringsAsFactors=F))

gganatogram(data=compareGroups, fillOutline='#a6bddb', organism='human', sex='male', fill="value") + 
theme_void() +
facet_wrap(~type) +
scale_fill_gradient(low = "white", high = "red") 

医薬データ解析のためのベイズ統計学

読んだ。

医薬データ解析のためのベイズ統計学

医薬データ解析のためのベイズ統計学

めっちゃ時間がかかってしかも記事にしておくのも時間かかってた。
 
古典的なp値の頻度論的な話も含んでいて、基礎の確認…にはならない。けっこう大変だった。
しかし、収束の判定法や、変数選択としての使い方とか、他のベイズ本ではあまりしっかり書いていないようなことも書かれているような気がした(読了したのが昔過ぎて記憶があやふやである)。

レプリカ交換法

読んだ。
Bayesian estimation of phase response curves. Neural Netw. 2010 Aug;23(6):752-63.
 
Phase response curve (PRC) という神経細胞の発火の記録を推定したいが、周期のズレや発火タイミングの変化などで普通にやったら推定が収束しないらしい。
レプリカ交換法は現時点でRstan では実装されていないので、コードをコンパイルしたものを使いまわして各iteration の最終サンプリング結果から取り出してきてやる方法がある。
StanとRでレプリカ交換MCMC(parallel tempering) を実行する - StatModeling Memorandum
 
曲線の推定は2階差分としてなめらかになるようにしている。prior に z_{j-1}-2z_j + z_{j+1}=(z_{j-1}-z_j)-(z_j-z_{j+1}) とする。

VARで本当にPKが多くなっているのか

MikuHatsune2018-07-03

ロシアW杯でVAR が導入されたことにより、PK の数が多いような印象である。実際、予選リーグの時点で過去最高だとか、いろいろ言われている。毎日新聞によると
https://mainichi.jp/articles/20180703/ddm/035/050/161000c

VARは、得点▽PK▽レッドカード▽警告などの選手間違い−−の4項目に関わるものに適用されるが、1次リーグではPKに関わるものが最も多かった。VARによりPKが認められたケースは7件で、PK回数は24件。逆に、VARによってPKが取り消されたケースは2件あった。

 1大会で実施されたPKの最多記録18(1990年イタリア、98年フランス、2002年日韓大会)を既に更新している。このほか、レッドカードの扱いが覆ったケースが2件あった。

ということである。
しかし、PK というのは1試合中にそうそう起こることではないので、単純にポアソン分布に従うと考えられる。とすると、ポアソン分布の平均は\lambda で、分散も\lambda であるので、いままでの平均を超えたからと言ってそんなに簡単に分布の裾にならないのである。
というわけでデータを取ってみる。RSSSF というサイトに2014から1930年大会の試合記録があって、そこにはPKでの得点だけではなく、PKの失敗(外した、セーブした)まで残っている。これを一生懸命見てみると、こんな感じのデータになる(ポアソン分布での解析をしたかったので、1試合中に複数回PKがあった場合も調べた)。
836試合で218回のPK があったようである。

year goal nogoal match pk2 pk3
2014 12 1 64 0 0
2010 9 6 64 1 0
2006 16 0 64 0 0
2002 13 5 64 1 0
1998 17 1 64 0 0
1994 15 0 52 0 0
1990 13 5 52 2 0
1986 12 4 52 1 0
1982 8 3 52 0 0
1978 12 2 38 0 0
1974 6 2 38 0 0
1970 5 0 32 0 0
1966 8 0 32 0 0
1962 8 1 32 0 0
1958 7 3 35 0 0
1954 7 1 26 0 0
1950 3 0 22 0 0
1938 3 2 18 0 0
1934 3 1 17 1 0
1930 1 3 18 0 1

 
さて、単純に、予選リーグ48試合で24回のPKがあったようなので、

poisson.test(c(24, sum(s1)), c(48, sum(s2)), alternative="greater")
	Comparison of Poisson rates

data:  c(24, sum(s1)) time base: c(48, sum(s2))
count1 = 24, expected count1 = 13.14, p-value = 0.003486
alternative hypothesis: true rate ratio is greater than 1
95 percent confidence interval:
 1.297443      Inf
sample estimates:
rate ratio 
  1.917431 

確かにPK は多いようである。
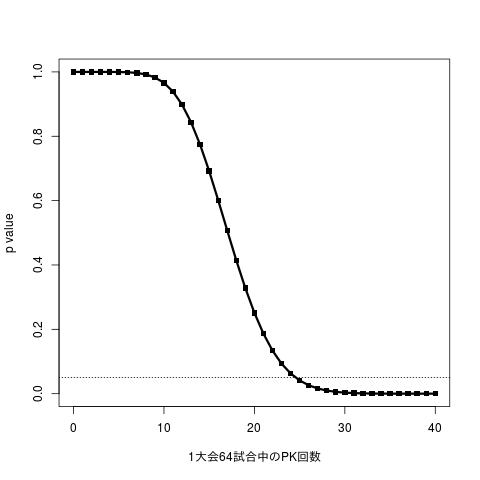
64試合すべて消化するまでに、何回PKがあれば有意に多そうだ、と言えるかというと、25回あると0.05 を下回る。
VAR によりPK が認められたのは予選リーグ48試合までで7回あるので、7回の上乗せ効果はやはりPK の回数増加に寄与してそうな感じはある。

g <- 0:40
pv <- mapply(function(z) poisson.test(c(z, sum(s1)), c(64, sum(s2)), alternative="greater")$p.value, g)

plot(g, pv, type="o", pch=15, xlab="1大会64試合中のPK回数", ylab="p value", lwd=3)
abline(h=0.05, lty=3)

W杯の試合観戦中にトイレはいついくべきか

MikuHatsune2018-06-25

こんなツイートを観測した。

 
ハーフタイムに水道使用料が増えているのがわかる。
試合中に離席すると一番盛り上がる得点シーンを見逃してしまうため、試合中はなかなかトイレやお風呂にいけない。
というわけで試合中に離席するにはどの時間帯が一番よいかを調べる。
 
高校サッカーの点差を解析したときと同様に、過去のW杯の試合結果から得点が入った時刻を取得する。ここで、1930年から2014年大会までの20大会(1942年と1946年は中止)について、836試合あり、得点シーンは2373だった(wikiFIFA W杯のページをパースしたため、本当にそうなのかはわからない)。
1970年大会が6ゴール取得できてなかったようである。

1930 1934 1938 1950 1954 1958 1962 1966 1970 1974 1978 1982 1986 1990 1994 1998 2002 2006 2010 2014 
  70   70   84   88  140  126   89   89   89   97  102  146  132  115  141  171  161  147  145  171 

 
いつ得点が入るかをベタに分布をとると、高校サッカー選手権とほぼ同様で、どの時間帯でもほぼ一様な感じである。ただし、アディショナルタイムはすべて45分もしくは90分に換算しており、後半90分はほかの時間帯に比べて突出して得点が入っているので、試合終了間際は離席せずに見届けたほうがよい。
前半では全体の44%、後半では56% の得点が分布するので、どちらかというと前半のほうに離席するのがよい。

 
ある時間帯に得点が入ってから、次の得点が入るまでの時間の分布は、ガンマ分布のようになる。このため、ガンマ分布で推定すると、パラメータ(1.266, 0.0554) をもつ以下のようなガンマ分布になる。
得点が入ってから17分間で、50% の確率で次の点がはいるようなので、得点が入った直後は油断しないほうがよい。

 
ある時間帯にN点差がついているときに、そのままリードして試合終了する確率も選手権の解析と同様にしてみたが、ほとんど高校サッカーと同じ結果になった。試合終了間際まで1点リードしているとき、劇的ゴールで追いつくのは2.4% しかない(89分時点で1点リードしてそのまま90分=試合終了までリードを保つ確率が97.6%)。
勝ったな(確信)と思って風呂にはいったり寝たりするのは、90%の確信度でいくならば1点差なら後半75分あたり、2点差なら前半30分あたりでよい。

 
今回のデータ取りはstringr を使ってR 内で完結させた。

# データとり
# wiki から
# W杯のトップページより、各グループステージ、決勝トーナメントの
# ページからデータをパースするほうが、フォーマットが整っていて効率がよい

url <- NULL
y1 <- seq(2014, 1998, -4)
lab <- c(sprintf("_Group_%s", LETTERS[1:8]), "_knockout_stage")
url <- c(url, mapply(function(z) sprintf("https://en.wikipedia.org/wiki/%d_FIFA_World_Cup%s", z, lab), y1))

y1 <- seq(1994, 1986, -4)
lab <- c(sprintf("_Group_%s", LETTERS[1:6]), "_knockout_stage")
url <- c(url, mapply(function(z) sprintf("https://en.wikipedia.org/wiki/%d_FIFA_World_Cup%s", z, lab), y1))

y1 <- 1982
lab <- c(sprintf("_Group_%s", c(1:6, LETTERS[1:4])), "_knockout_stage")
url <- c(url, mapply(function(z) sprintf("https://en.wikipedia.org/wiki/%d_FIFA_World_Cup%s", z, lab), y1))

y1 <- c(1978, 1974)
lab <- c(sprintf("_Group_%s", c(1:4, LETTERS[1:2])), "_knockout_stage")
url <- c(url, mapply(function(z) sprintf("https://en.wikipedia.org/wiki/%d_FIFA_World_Cup%s", z, lab), y1))

y1 <- c(seq(1970, 1954, -4), 1930)
lab <- c(sprintf("_Group_%s", 1:4), "_knockout_stage")
url <- c(url, mapply(function(z) sprintf("https://en.wikipedia.org/wiki/%d_FIFA_World_Cup%s", z, lab), y1))

y1 <- 1950
lab <- c(sprintf("_Group_%s", 1:4), "_final_round")
url <- c(url, mapply(function(z) sprintf("https://en.wikipedia.org/wiki/%d_FIFA_World_Cup%s", z, lab), y1))

y1 <- c(1938, 1934)
lab <- c(sprintf("_Group_%s", 1:4), "_final_tournament")
url <- c(url, mapply(function(z) sprintf("https://en.wikipedia.org/wiki/%d_FIFA_World_Cup%s", z, lab), y1))
write(url, "list.txt")

# パース
library(stringr)
fi <- list.files(pattern="FIFA")
Res <- NULL
g <- 0
for(f in fi){
  txt <- readLines(f)
  flag <- c("score"=0, "right"=1)
  res <- NULL
  for(tmp in txt){
    #if(str_detect(tmp, "<th style.*\\d+&#8211;\\d+.*</th>")){
    if(str_detect(tmp, "<th style.*&#8211;.*</th>")){ # 1986年のグループステージが半角スペースがあっておかしい
      flag["score"] <- 1
      goaltime <- vector("list", 2)
    }
    if(flag["score"] == 1){
      if(str_detect(tmp, "[\\d+]+'")){
        goaltime[[ flag["right"] ]] <- c(goaltime[[ flag["right"] ]], gsub("'", "", str_extract_all(tmp, "[\\d+]+'")[[1]]))
      }
      if(str_detect(tmp, "Report")){
        flag["right"] <- 2
      }
      if(str_detect(tmp, "</table>")){
        res <- c(res, list(goaltime))
        flag <- c("score"=0, "right"=1)
      }
    }
  }
  year <- as.numeric(str_extract(f, "\\d+"))
  for(i in seq(res)){
    g <- g + 1
    for(j in seq(res[[i]])){
      for(k in res[[i]][[j]]){
        l <- as.numeric(strsplit(k, "\\+")[[1]])
        hoge <- c(year, g, j, l, rep(0, 2-length(l)))
        Res <- rbind(Res, hoge)
      }
    }
  }
}
colnames(Res) <- c("year", "gameID", "HA", "time", "extra")
# 解析
dat <- read.table("score.txt", header=TRUE)
# 試合数の確認
Ngame <- c(18, 17, 18, 22, 26, 35, rep(32, 3), 38, 38, rep(52, 4), rep(64, 5))
mapply(function(z) length(unique(z$gameID)), split(dat, dat$year))

# 得点時間分布
sb <- subset(dat, time <= 90)
t1 <- 1:45
t2 <- 46:90
tab <- table(factor(sb$time, c(t1, t2)))/nrow(sb) * 100

cols <- c("red", "green")
par(mar=c(5, 5, 2, 2), cex.lab=1.6, cex.main=2)
b <- barplot(tab, col=c(mapply(rep, cols, each=sapply(list(t1, t2), length))), las=1, main="得点時間分布", ylab="頻度[%]", ylim=c(0, 3))
mtext("前半(分)", 1, line=3, at=mean(t1))
mtext("後半(分)", 1, line=3, at=mean(t2)+15)

# 得点間隔
sb <- dat
Tgoal <- lapply(split(sb$time, sb$gameID), sort)
difftime <- lapply(Tgoal, function(z) tail(c(0, z), -1) - head(c(0, z), -1))
difftime <- unlist(difftime)

library(rstan)
rstan_options(auto_write = TRUE)
options(mc.cores = parallel::detectCores())

# ガンマ分布による得点時間間隔
code <- "
data{
  int N;
  vector<lower=0>[N] Time;
}
parameters{
  real<lower=0, upper=50> p[2];
}
model{
  Time ~ gamma(p[1], p[2]);
}
"

m <- stan_model(model_code=code)
standata <- list(N=length(difftime), Time=difftime)
fit <- sampling(m, data=standata, iter=6000, warmup=1500, seed=1234)
ex <- extract(fit)

tab <- table(factor(difftime, 0:max(difftime)))/length(difftime) * 100
b <- barplot(tab, las=1)
ps <- apply(ex$p, 2, median)
x0 <- seq(0, max(difftime), length=1000)
y0 <- dgamma(x0, ps[1], ps[2])

alpha <- c(0.25, 0.5, 0.75, 0.9)
d0 <- c(5, 0.2)
par(mar=c(5, 5, 2, 2), cex.lab=1.6, cex.main=2)
plot(tab, xlab="前の得点からの経過時間(分)", ylab="頻度[%]", las=1)
lines(x0, y0*100, col=2, lwd=3)
for(i in seq(alpha)){
  x1 <- qgamma(alpha[i], ps[1], ps[2])
  y1 <- dgamma(x1, ps[1], ps[2])*100
  arrows(x1+d0[1], y1+d0[2], x1, y1, length=0.1, lwd=3, col=4)
  points(x1, y1, pch=16, col=4)
  text(x1+d0[1], y1+d0[2], sprintf("%2d %s (%.1f min)", alpha[i]*100, "%", x1), pos=4)
  title("次の得点の時間の分布")
}

# 得点差勝利確率
sb <- subset(dat, time <= 90)
mat <- mat0 <- mat1 <- mat2 <- matrix(0, max(dat$gameID), 90)
idx <- c(1, -1)
for(i in unique(sb$gameID)){
  tmp <- subset(sb, gameID==i)
  tmp <- tmp[order(tmp$time),]
  for(j in 1:nrow(tmp)){
    mat[i, tmp$time[j] ] <- mat[i, tmp$time[j]] + idx[tmp$HA[j]]
  }
}

mat0[,1] <- mat[,1]
for(j in 2:ncol(mat)){
  mat0[,j] <- mat0[, j-1] + mat[, j]
}

# 1点差以上
mat1[abs(mat0) > 0] <- 1
prob1 <- prob2 <- rep(0, 89)
for(j in 1:89){
  j1 <- mat1[, j] > 0
  prob1[j] <- mean(sapply(apply(mat1[j1, j:90], 1, unique), length) <= 1)
}

mat2 <- abs(mat0)
for(j in 1:89){
  j1 <- mat2[, j] > 1
  prob2[j] <- mean(apply(mat2[j1, j:90] > 0, 1, all))
}

p <- cbind(prob1, prob2)
par(mar=c(5, 5, 2, 4), cex.lab=1.6, cex.main=2, las=1)
matplot(p, xlab="時間", ylab="勝利確率", col=cols, pch=16, xaxp=c(0, 90, 6))
abline(v=45, lty=3)
legend("bottomright", legend=sprintf("%d 点差", 2:1), col=rev(cols), pch=16, cex=2)
text(par()$usr[2], tail(p[,1], 1), sprintf("%.1f %s", tail(p[,1], 1)*100, "%"), pos=4, xpd=TRUE)

single cell の分化系統樹解析

読んだ。
A comparison of single-cell trajectory inference methods: towards more accurate and robust tools.
 
single cell のRNAseq などからデータを取得して、細胞分化系統樹を解析するのに多種多様な手法やパッケージが出ている。
59手法を試してみて、分化系統樹にどのような仮定をおくかをフローチャート形式にして、どういう場合にどういう手法を使うのがよいか、まで提言している。
とりあえずSlingshot, monocle, TSCAN, cellTree あたりを使っておけばよさそうである。

vim 8.1 にしたら \ の後は / か ? か & でなければなりませんって文句言われるし"Vim: Caught deadly signal ABRT" って言われて突然落ちる

vim 8.0 でvimrc をいい感じにしていたのに、ppa (https://launchpad.net/~jonathonf/+archive/ubuntu/vim) を

sudo add-apt-repository ppa:jonathonf/vim

vim-gnome をインストールすると 8.1 がインストールされるようになっている。
そうすると、いままで 8.0 ではエラーが出ていなかったのに、

\ の後は / か ? か & でなければなりません

って起動時に毎回文句言われるようになった。これは

vim -N

で回避できるらしいが、肝心のスクリプトを書いているときに

Vim: Caught deadly signal ABRT

と言われて突然落ちる。python を書いているときに頻発する。
パッチの問題とか言われているようだが、パッチの当て方がよくわからないので vim 8.0 がapt-get できるようにしたいが、ppa をいくらいじっても 8.1 しか出てこない。
 
こちらのppa (https://launchpad.net/~laurent-boulard/+archive/ubuntu/vim) を使うと

sudo add-apt-repository ppa:laurent-boulard/vim
sudo apt-cache policy vim-gnome
vim-gnome:
  インストールされているバージョン: 2:8.0.1520-1~xenial~lboulard+1
  候補:               2:8.0.1520-1~xenial~lboulard+1
  バージョンテーブル:
 *** 2:8.0.1520-1~xenial~lboulard+1 500
        500 http://ppa.launchpad.net/laurent-boulard/vim/ubuntu xenial/main amd64 Packages
        500 http://ppa.launchpad.net/laurent-boulard/vim/ubuntu xenial/main i386 Packages
        100 /var/lib/dpkg/status
     2:7.4.1689-3ubuntu1.2 500
        500 http://jp.archive.ubuntu.com/ubuntu xenial-updates/main amd64 Packages
        500 http://security.ubuntu.com/ubuntu xenial-security/main amd64 Packages
     2:7.4.1689-3ubuntu1 500
        500 http://jp.archive.ubuntu.com/ubuntu xenial/main amd64 Packages

ようやく出るようになった。
 
いやでもやっぱりpython で落ちる。