Scan statisiticsというのを聞いたのだが、空間統計学の一種らしい。
Spatial scan statistics are used to determine hotspots in spatial data, and are widely used in epidemiology and biosurveillance. In recent years, there has been much effort invested in designing effcient algorithms for finding such "high discrepancy" regions, with methods ranging from fast heuristics for special cases, to general grid-based methods, and to efficient approximation algorithms with provable guarantees on performance and quality.
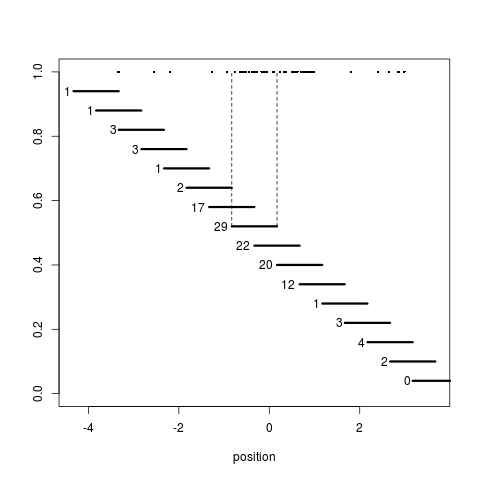
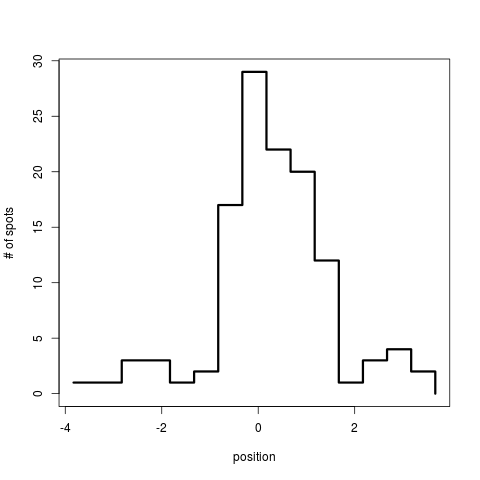
空間統計学は一般的には疫学によく用いられるらしい。コレラと井戸の話はよく出てくるが、この scan statistics を遺伝学的に使うのはどういうことかというと、数直線状に伸ばしたDNA鎖に対して、例えばレアバリアントとなるものが乗っていて、その hotspot 具合を ある幅をもった window をチマチマ動かしてその window 上に hotspot がいくつあるかをカウントするらしい。
時系列があればburst modelに似てないこともないような気がするけど、数直線的(空間的)な密度で考えると window になるんだろう。
Rでは DCluster, SpatialEpiといったパッケージが scan statistics に使えるらしい。
x1 <- runif(5,  min=-5, max=-1)
x2 <- runif(50, min=-1, max=1) # hotspot
x3 <- runif(5,  min=1 , max=5)
x0 <- sort(c(x1, x2, x3))

Wlen <- 1 # window の幅
Wstart <- seq(min(x0) - Wlen, max(x0) + Wlen, by=0.5) # window の開始地点

plot(x0, rep(1, length(x0)), pch=16, cex=0.5, xlim=range(Wstart), ylim=c(0, 1), xlab="position", ylab="")
mapply(function(i) segments(Wstart[i], 1 - 0.06*i, Wstart[i] + Wlen, lwd=3), head(seq(Wstart), -1L)) # 各window
i <- 8 # ある window の例
segments(Wstart[i], 1 - 0.06*i, y1=1, lty=2)
segments(Wstart[i] + Wlen, 1 - 0.06*i, y1=1, lty=2)

# 各 window に含まれる spot の数
spots <- mapply(function(i) sum(x0 >= Wstart[i] & x0 <= Wstart[i] + Wlen), head(seq(Wstart), -1L))
mapply(function(i) text(Wstart[i], 1 - 0.06*i, spots[i], adj=c(1.3, NA)), head(seq(Wstart), -1L))

plot(head(Wstart, -1L) + Wlen/2, spots, type="s", lwd=3, xlab="position", ylab="# of spots")

