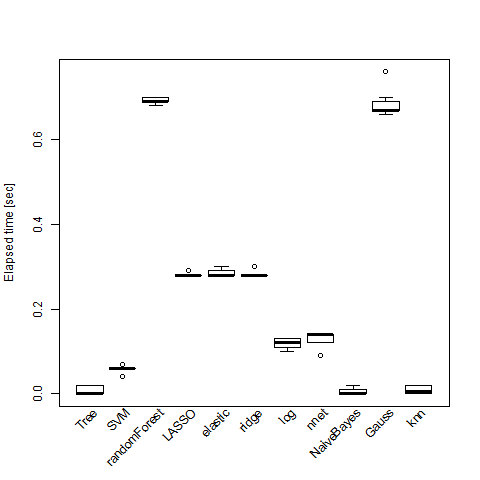
機械学習の評価として、Recall, Precision, F値, Matthews correlation coefficient (MCC)があるので、Rでできる機械学習をひたすらやって性能評価をしてみる。
今回は交差検証は行わず、データセットの全てのデータでモデルを構築して、それを元のデータに戻すだけにする。
で定義される。
Machine Learning Repositoryから、二値分類に使えそうなspam (kernlab) と BreastCanser (mlbench)でやってみる。
結果としては、とりあえずrandomforestしておけばいいんじゃないかという感じになった。ANNもなかなかよい。Deep learning もここからなんとか勉強したい。
ガウス過程分類はspamのようにサンプルとパラメータが多い時に死ぬほど計算時間がかかるので計算時には注意したい。
もっと真面目になるならパラメータのtuning (SVMやrandomForest)が必要だが、面倒なので割愛!!
# BreastCancer
             recall    precisiion F         MMC       elapse
Tree         0.9623431 0.9623431  0.9623431 0.9420728 0.006
SVM          0.9665272 0.9467213  0.9565217 0.9328627 0.059
randomForest 0.9790795 0.9473684  0.962963  0.9428248 0.691
LASSO        0.958159  0.958159   0.958159  0.9356365 0.282
elastic      0.958159  0.958159   0.958159  0.9356365 0.286
ridge        0.9539749 0.9579832  0.9559748 0.9323578 0.282
log          1         1          1         1         0.119
nnet         1         1          1         1         0.13
NaiveBayes   0.9874477 0.9477912  0.9672131 0.9494842 0.005
Gauss        0.9748954 0.9588477  0.966805  0.9487854 0.682
knn          0.9707113 0.9707113  0.9707113 0.9549455 0.009
# spam
             recall    precisiion F         MMC       elapse
Tree         0.8720353 0.9144014  0.892716  0.8262535 0.116
SVM          0.9167126 0.948089   0.9321368 0.889554  2.478
randomForest 0.9288472 0.9562748  0.9423615 0.9060278 9.752
LASSO        0.8946498 0.9321839  0.9130312 0.8588498 23.202
elastic      0.8913403 0.9308756  0.9106791 0.8551788 23.122
ridge        0.8521787 0.925704   0.887421  0.8208929 4.39
log          0.892995  0.9299253  0.9110861 0.8556405 0.296
nnet         0.9365692 0.9491336  0.9428096 0.9060808 1.068
NaiveBayes   0.9481522 0.5840979  0.7228764 0.5181849 0.176
Gauss        0.9097561 0.9467005  0.9278607 0.8798849 4192.99
knn          0.8769994 0.8867819  0.8818636 0.8057751 1.532
ML.Performance <- function(response, parameter, niter=3){
	# response  は二値応答ベクトル
	# parameter は統計量の matrix
	# niter     は計算時間比較のための演算回数
	type <- response
	mat <- parameter
	input <- na.omit(as.data.frame(cbind(mat, type)))
	timemat <- matrix(0, nr=11, nc=niter)
	for(i in seq(niter)){
		# Tree
		library(tree)
		timemat[1, i] <- system.time(t0 <- tree(type ~ ., data=input))[3]
		#plot(t0); text(t0)
		p0 <- predict(t0, input, type="class")
		r0 <- table(input$type, p0)

		# SVM
		library(e1071)
		timemat[2, i] <- system.time(s0 <- svm(type ~ ., data=input))[3]
		p1 <- predict(s0, input)
		r1 <- table(input$type, p1)

		# randomforest
		library(randomForest)
		timemat[3, i] <- system.time(f0 <- randomForest(type ~ ., data=input))[3]
		r2 <- table(input$type, f0$predict)

		# LASSO
		library(glmnet)
		idx <- which(colnames(input) == "type")
		hoge <- apply(as.matrix(input[,-idx]), 2, as.numeric)
		func0 <- function(){
			g0 <- glmnet(hoge, input$type, family="binomial", alpha=1)
			cv0 <- cv.glmnet(hoge, input$type, family="binomial", alpha=1)
			list(g0, cv0$lambda.min)
		}
		timemat[4, i] <- system.time(funcres0 <- func0())[3]
		r3 <- table(input$type, predict(funcres0[[1]], hoge, s=funcres0[[2]], type="class"))

		# Elastic Net
		func1 <- function(){
			g6 <- glmnet(hoge, input$type, family="binomial")
			cv6 <- cv.glmnet(hoge, input$type, family="binomial")
			list(g6, cv6$lambda.min)
		}
		timemat[5, i] <- system.time(funcres1 <- func1())[3]
		r6 <- table(input$type, predict(funcres1[[1]], hoge, s=funcres1[[2]], type="class"))

		# ridge
		idx <- which(colnames(input) == "type")
		g5 <- glmnet(hoge, input$type, family="binomial", alpha=0)
		cv5 <- cv.glmnet(hoge, input$type, family="binomial", alpha=0)
		func2 <- function(){
			g5 <- glmnet(hoge, input$type, family="binomial", alpha=0)
			cv5 <- cv.glmnet(hoge, input$type, family="binomial", alpha=0)
			list(g5, cv5$lambda.min)
		}
		timemat[6, i] <- system.time(funcres2 <- func2())[3]
		r5 <- table(input$type, predict(funcres2[[1]], hoge, s=funcres2[[2]], type="class"))

		# glm
		timemat[7, i] <- system.time(g1 <- glm(type ~ ., data=input, family="binomial"))[3]
		p4 <- predict(g1, input, type="res")
		l4 <- replace(rep(levels(type)[1], nrow(input)), p4 >= 0.5, levels(type)[2])
		r4 <- table(input$type, l4)

		# neural net
		library(nnet)
		timemat[8, i] <- system.time(n0 <- nnet(type ~ ., data=input, size=3))[3]
		r7 <- table(input$type, predict(n0, input, type="class"))

		# naive bayese
		library(klaR)
		timemat[9, i] <- system.time(nb0 <- NaiveBayes(type ~ ., data=input))[3]
		p8 <- predict(nb0, input, type="class")
		r8 <- table(input$type, p8$class)

		# Gaussian processing
		library(kernlab)
		if(nrow(input) < 1000){
			timemat[10, i] <- system.time(g9 <- gausspr(type ~ ., data=input))[3]
			r9 <- table(input$type, predict(g9, input))
		} else { # 計算に時間がかかるので
			size0 <- c(300, 500, 800, 1000)
			time1 <- rep(0, length(size0))
			for(s0 in seq(size0)){
				idx0 <- sample(seq(type), size=size0[s0])
				time1[s0] <- system.time(g9 <- gausspr(type ~ ., data=input[idx0,]))[3]
				r9 <- table(input$type[idx0], predict(g9, input[idx0,]))
			}
			lm0 <- lm(log(time1) ~ log(size0))
			timemat[10, i] <- exp(sum(lm0$coefficients * c(1, log(nrow(input))))) # spam ならこんな感じで線形回帰に乗る
		}

		# k neiberhood
		library(class)
		timemat[11, i] <- system.time(k10 <- knn(input[, !colnames(input)=="type"], input[, !colnames(input)=="type"], cl=input$type, k=2))[3]
		r10 <- table(input$type, k10)
	}
	# 統計量を算出する関数
	stats <- function(mat){
		recall <- mat[2,2]/sum(mat[2,])
		precision <- mat[2,2]/sum(mat[,2])
		F <- (2*recall*precision)/(recall+precision)
		MMC <- (prod(diag(mat))-mat[1,2]*mat[2,1])/sqrt(prod(rowSums(mat), colSums(mat)))
		ret <- list(recall=recall, precisiion=precision, F=F, MMC=MMC)
	}
	res <- list(Tree=r0, SVM=r1, randomForest=r2, LASSO=r3, elastic=r6, ridge=r5, log=r4, nnet=r7, NaiveBayes=r8, Gauss=r9, knn=r10)
	elapse <- rowMeans(timemat)
	performance <- t(sapply(res, stats))
	rownames(timemat) <- rownames(performance)
	result <- cbind(performance, elapse)
	boxplot(t(timemat), xaxt="n", ylab="Elapsed time [sec]")
	text(seq(nrow(timemat)), rep(par()$usr[3], length(nrow(timemat))), rownames(timemat), xpd=TRUE, srt=45, adj=c(1,1))
	return(list(result=result, elapsed=timemat))
}
